Moving averages
 Moving average
Moving average is a widely used indicator in technical analyses that helps smooth-out the price action by filtering out the “noise” from all of the random price fluctuations. A moving average (MA) is a trend-following or lagging indicator, because it is based on all former prices. The two basic and commonly used MA's are - the simple moving average (SMA), which is a simple average of security over a defined number of time periods, and the exponential moving average (EMA), which gives more weight to the most recent prices. The most common applications of MA's are to identify the trend's upcoming direction and to determine the support and resistance levels. While MA's are useful enough on their own, they also form the basis for other indicators, such as - the Moving Average Convergence Divergence (MACD)
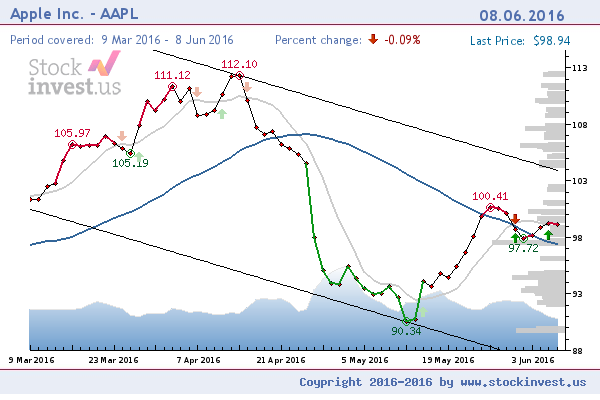
1) For the long-term - we use the standard 100 and 200 days moving average. (Dark Blue line)
2) For the short-term we use dynamically Moving Average that is being calculated upon the number of days in the chart. (Grey line)
Explanation:
Using a dynamically calculated Moving Average is the correct approach, even though many swear to the standards of 4, 7, 8, 9, 12, 15,
18, 21, 23, 26, 27, 29, 32, 35, 100, 200 based on standard 1,3,6,12,24,48 and 96 months charts. But what happens with charts not having the full length of their changes history?
Mathematical solution:
Moving Average = ((Num of days / 5) / 2) + 1
Example:
3 MND equals approx. 66 days of history
Moving Average = ((66 / 5) / 2) + 1 => 7.6 (Equals 8 days of moving average)
1 year equals approx 264 days of history
Moving Average = ((264 / 5) / 2) + 1 => 27,4 (Equals 28 days of moving average)
Using dynamic approach to set, the correct Moving Average length for short-term shows that it's particularly useful when dealing with charts that don't have full set of historical data.
.
Most Read
Most Read
Top Fintech Company
![]() featured in The Global Fintech Index 2020 as the top Fintech company of the country.
featured in The Global Fintech Index 2020 as the top Fintech company of the country.