NASDAQ:BGFV
Big 5 Sporting Goods Corporation Stock Earnings Reports
$3.33
+0.100 (+3.10%)
At Close: Apr 23, 2024
Earnings Per Share
BGFV Upcoming Earnings (Q1 2024)
| Earnings Date: | May 07, 2024 |
| Consensus EPS: | Premium |
Current P/E ratio : -10.25
Price (Apr 23, 2024, EOD): $3.33
The P/E ratio (price-to-earnings ratio) is a financial metric used to assess a company's stock valuation. It is calculated by dividing the stock price by its earnings per share. A higher ratio suggests higher investor expectations, while a lower ratio may indicate undervaluation. It helps investors evaluate potential investments, but it's essential to consider other factors too.
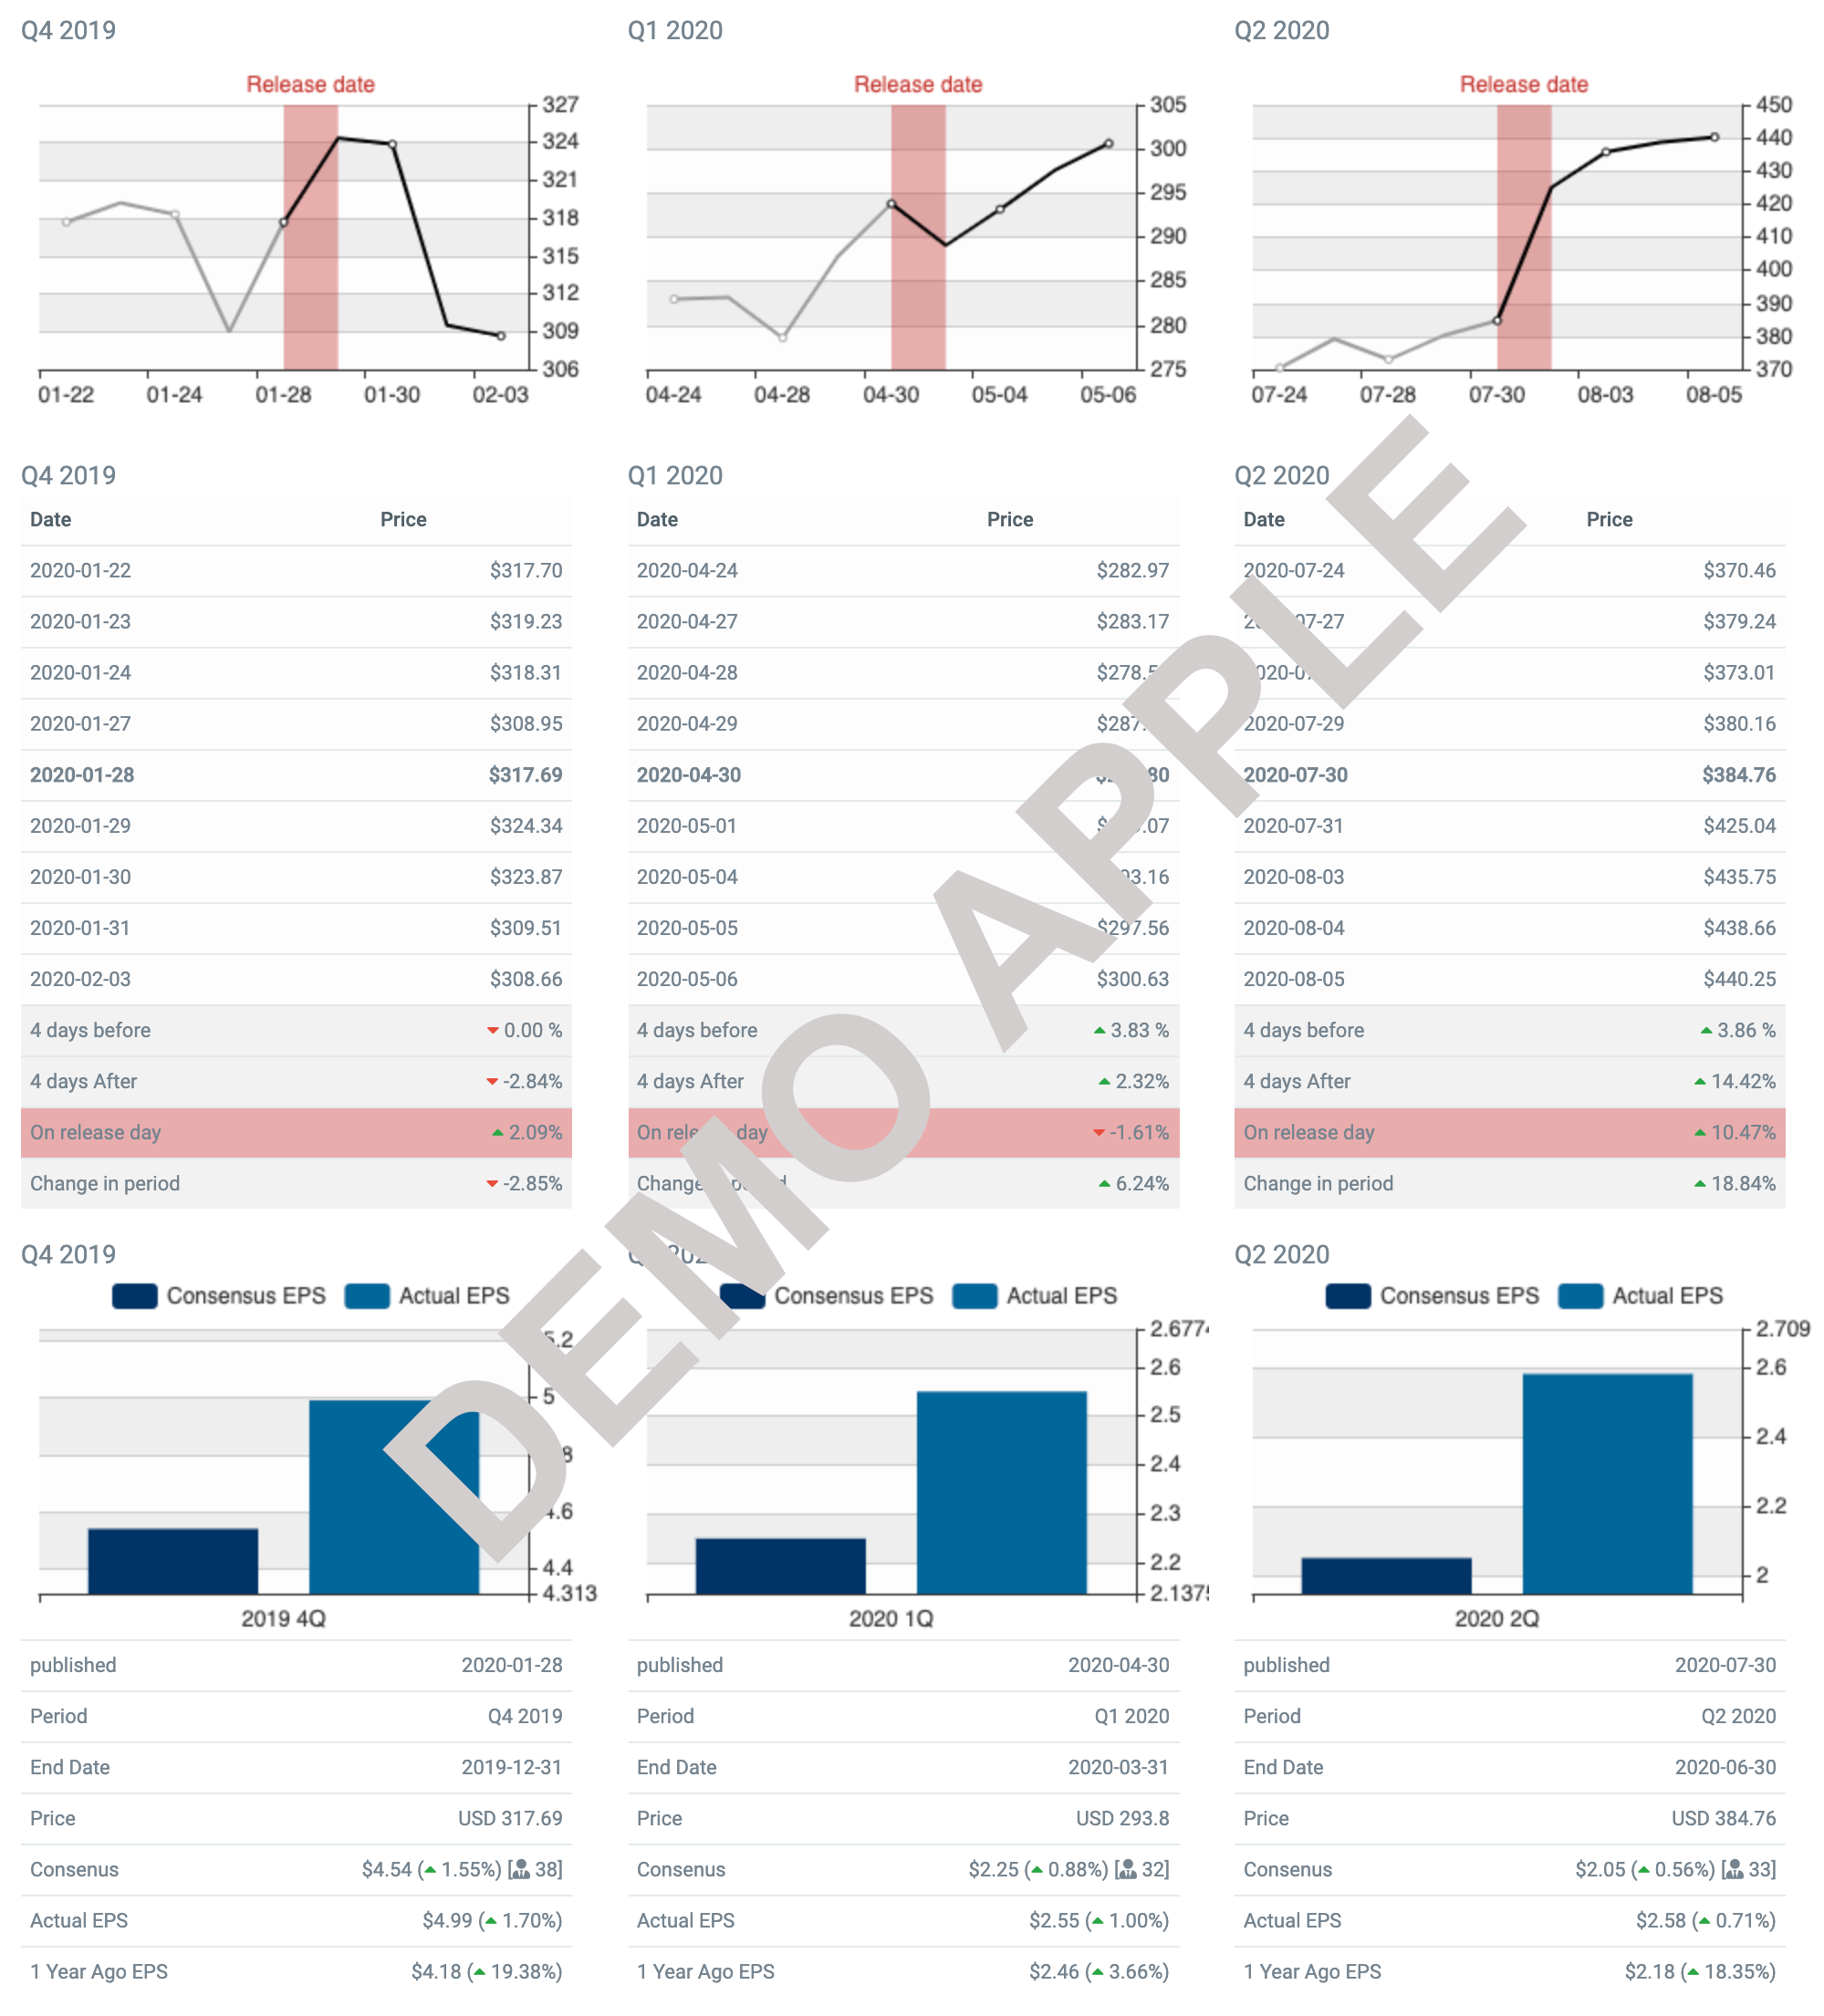
Last 3 Quarters for BGFV Premium
FAQ
When is the earnings report for BGFV?
Big 5 Sporting Goods Corporation (BGFV) has scheduled its earnings report for May 07, 2024 before the markets open.
What is the BGFV price-to-earnings (P/E) ratio?
BGFV P/E ratio as of Apr 23, 2024 (TTM) is -10.25.
What is the BGFV EPS forecast?
The forecasted EPS (Earnings Per Share) for Big 5 Sporting Goods Corporation (BGFV) for the first fiscal quarter 2024 is -$0.350.
What are Big 5 Sporting Goods Corporation's retained earnings?
On its balance sheet, Big 5 Sporting Goods Corporation reported retained earnings of $196.35 million for the latest quarter ending Dec 31, 2023.
What Is an Earnings Report?
An earnings report is usually issued quarterly (Q1, Q2, Q3 & Q4) by public companies to report their performance. Earnings reports typically include net income, earnings per share, earnings from continuing operations, and net sales. Looking at the earnings report investors can start gauge the financial health of the company and make even better decisions whether to buy, sell, or stay in the company. Fundamental analysts and value investors will typically hunt for stocks that continue to show good financial ratios and use a decline as an exit point. One of the most anticipated numbers for analysis is earnings per share because it indicates how much the company earned for its shareholders. The report will also indicate a possible dividend.
Earnings Report Content
Earnings reports generally provide an update of all three financial statements, including the income statement, the balance sheet, and the cash flow statement. These figures are typically measured against previous quarters/years. Furthermore, the earnings report usually includes a summary and analysis from the CEO or company spokesman, alongside a more general view of the financials and future forecast.
What To Know About Earnings Reports?
Announcement of earnings for a stock, particularly for well followed large-capitalization stocks, can move the market. Stock prices can fluctuate wildly on days when the quarterly earnings report is released. Despite good reports, stocks may very well fall if the investors were expecting more or they believe the next quarter will not be as good. Investors always try to be ahead of the market and future earnings/losses are often discounted into the current price of the stock. It is natural for stocks to start to move in either direction a few days before the release of an earnings report.


