Adelaide Brighton Limited Stock Forecast
Red day on Wednesday for Adelaide Brighton Limited
(Updated on Apr 17, 2024)
The Adelaide Brighton Limited stock price fell by -0.317% on the last day (Wednesday, 17th Apr 2024) from $3.15 to $3.14. During the last trading day the stock fluctuated 0.318% from a day low at $3.14 to a day high of $3.15. The price has been going up and down for this period, and there has been a 0% change for the last 2 weeks. Volume has increased on the last day by 304 thousand shares but on falling prices. This may be an early warning and the risk will be increased slightly over the next couple of days. In total, 1 million shares were bought and sold for approximately $4.53 million.
The stock lies in the lower part of a narrow and weak rising trend in the short term, and this may normally pose a very good buying opportunity. If the lower trend floor at $3.13 is broken, it will firstly indicate a slower rate of rising, but may also be an early warning for a trend shift. Given the current short-term trend, the stock is expected to rise 3.12% during the next 3 months and, with a 90% probability hold a price between $3.23 and $3.31 at the end of this 3-month period.
ABC.AX Signals & Forecast
The Adelaide Brighton Limited stock holds a sell signal from the short-term Moving Average; at the same time, however, there is a buy signal from the long-term average. Since the short-term average is above the long-term average there is a general buy signal in the stock giving a positive forecast for the stock. On further gains, the stock will meet resistance from the short-term Moving Average at approximately $3.15. On a fall, the stock will find some support from the long-term average at approximately $3.14. A break-up through the short-term average will send a buy signal, whereas a breakdown through the long-term average will send a sell signal. Furthermore, there is a buy signal from the 3 month Moving Average Convergence Divergence (MACD). Some negative signals were issued as well, and these may have some influence on the near short-term development. A sell signal was issued from a pivot top point on Tuesday, April 16, 2024, and so far it has fallen -0.317%. Further fall is indicated until a new bottom pivot has been found. Volume rose on falling prices yesterday. This may be an early warning and the stock should be followed more closely.
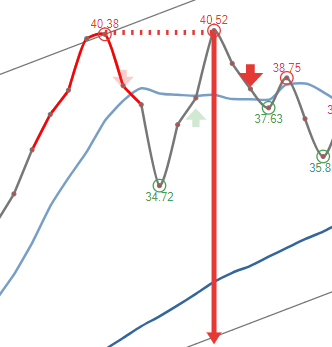 A sell signal from a double top formation was found on Tuesday, April 16, 2024 and based on theory for this formation the price should fall by -1.59% to $3.09 within 45 trading days since signal was issued (Thursday, April 18, 2024).
Support, Risk & Stop-loss for Adelaide Brighton Limited stock
Adelaide Brighton Limited finds support from accumulated volume at $3.13 and this level may hold a buying opportunity as an upwards reaction can be expected when the support is being tested.
In general the stock tends to have very controlled movements and with good liquidity the risk is considered very low in this stock. During the last day, the stock moved $0.0100 between high and low, or 0.318%. For the last week the stock has had daily average volatility of 0.382%.
Our recommended stop-loss: $3.05 (-2.98%) (This stock has low daily movements and this gives low risk. There is a sell signal from a pivot top found 1 day ago.)
Trading Expectations (ABC.AX) For The Upcoming Trading Day Of Thursday 18th
For the upcoming trading day on Thursday, 18th we expect Adelaide Brighton Limited to open at $3.14, and during the day (based on 14 day Average True Range), to move between $3.12 and $3.16, which gives a possible trading interval of +/-$0.0156 (+/-0.50%) up or down from last closing price. If Adelaide Brighton Limited takes out the full calculated possible swing range there will be an estimated 0.99% move between the lowest and the highest trading price during the day.
Since the stock is closer to the resistance from accumulated volume at $3.15 (0.32%) than the support at $3.13 (0.32%), our systems don't find the trading risk/reward intra-day attractive and any bets should be held until the stock is closer to the support level.
Is Adelaide Brighton Limited stock A Buy?
Several short-term signals, along with a general good trend, are positive and we conclude that the current level may hold a buying opportunity as there is a fair chance for Adelaide Brighton Limited stock to perform well in the short-term.
Current score: 1.702 Buy Candidate Unchanged
Predicted Opening Price for Adelaide Brighton Limited of Thursday, April 18, 2024
| Fair opening price April 18, 2024 | Current price |
|---|---|
| $3.14 ( 0.106%) | $3.14 |
The predicted opening price is based on yesterday's movements between high, low, and closing price.
Trading levels for ABC.AX
Fibonacci Support & Resistance Levels
| Level | Price | |||
|---|---|---|---|---|
| Resistance | R3 | 3.15 | 0.425 % | |
| R2 | 3.15 | 0.303 % | ||
| R1 | 3.15 | 0.228 % | ||
| Current price: | 3.14 | |||
| Support | S1 | 3.14 | -0.0155 % | |
| S2 | 3.14 | -0.0907 % | ||
| S3 | 3.13 | -0.212 % |
Accumulated Volume Support & Resistance Levels
| Level | Price | |||
|---|---|---|---|---|
| Resistance | R3 | 0 | . | |
| R2 | 0 | . | ||
| R1 | 3.15 | 0.318 % | ||
| Current price | 3.14 | |||
| Support | S1 | 3.13 | -0.318% | |
| S2 | 3.11 | -0.96% | ||
| S3 | 3.06 | -2.55% |
ABC Dividend Payout History
| # | Ex-Date | Pay Date | Amount | Yield | |
|---|---|---|---|---|---|
| 1 | Sep 21, 2022 | Sep 21, 2022 | Sep 21, 2022 | $0.0500 | 2.55% |
| 2 | Mar 25, 2022 | Mar 25, 2022 | Mar 25, 2022 | $0.0700 | 2.25% |
| 3 | Sep 22, 2021 | Sep 22, 2021 | Sep 22, 2021 | $0.0550 | 1.67% |
| 4 | Apr 07, 2021 | Apr 07, 2021 | Apr 07, 2021 | $0.0725 | 2.13% |
| 5 | Sep 21, 2020 | Sep 21, 2020 | Sep 21, 2020 | $0.0475 | 1.70% |
FAQ
Click here for our free guide on how to buy Adelaide Brighton Limited Stock.