Adams Resources & Energy Inc Stock Forecast
Red day on Friday for Adams Resources & Energy Inc stock after losing 0.678%
(Updated on Apr 19, 2024)
The Adams Resources & Energy Inc stock price fell by -0.678% on the last day (Friday, 19th Apr 2024) from $29.52 to $29.32. During the last trading day the stock fluctuated 1.35% from a day low at $28.96 to a day high of $29.35. The price has been going up and down for this period, and there has been a -2.04% loss for the last 2 weeks. Volume fell on the last day along with the stock, which is actually a good sign as volume should follow the stock. On the last day, the trading volume fell by -1 thousand shares and in total, 3 thousand shares were bought and sold for approximately $74.12 thousand.
The stock lies in the middle of a very wide and strong rising trend in the short term and a further rise within the trend is signaled. Given the current short-term trend, the stock is expected to rise 22.23% during the next 3 months and, with a 90% probability hold a price between $32.21 and $40.77 at the end of this 3-month period.
Ready to grow your portfolio? Here's your beginner's guide to opening a free brokerage account.
AE Signals & Forecast
The Adams Resources & Energy Inc stock holds buy signals from both short and long-term Moving Averages giving a positive forecast for the stock. Also, there is a general buy signal from the relation between the two signals where the short-term average is above the long-term average. On corrections down, there will be some support from the lines at $29.13 and $27.49. A breakdown below any of these levels will issue sell signals. Some negative signals were issued as well, and these may have some influence on the near short-term development. A sell signal was issued from a pivot top point on Monday, April 08, 2024, and so far it has fallen -2.23%. Further fall is indicated until a new bottom pivot has been found. Furthermore, there is currently a sell signal from the 3 month Moving Average Convergence Divergence (MACD). Volume fell along with the price during the last trading day which is technical positive. One should, however, note that this stock may have low liquidity in periods, which increases the general risk. The very low volume increases the risk and reduces the other technical signals issued.
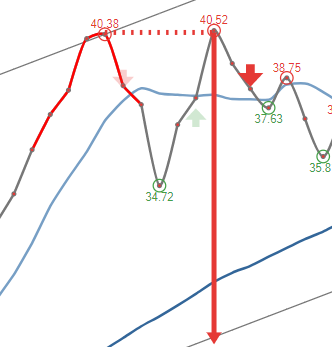 A sell signal from a double top formation was found on Monday, April 08, 2024 and based on theory for this formation the price should fall by -30.27% to $20.45 within 25 trading days since signal was issued (Monday, April 22, 2024).
Support, Risk & Stop-loss for Adams Resources & Energy Inc stock
On the downside, the stock finds support just below today's level from accumulated volume at $26.81 and $24.55. There is a natural risk involved when a stock is testing a support level, since if this is broken, the stock then may fall to the next support level. In this case, Adams Resources & Energy Inc finds support just below today's level at $26.81. If this is broken, then the next support from accumulated volume will be at $24.55 and $24.00.
This stock has average movements during the day, but be aware of low or falling volume as this increases the risk. During the last day, the stock moved $0.390 between high and low, or 1.35%. For the last week the stock has had daily average volatility of 3.25%.
Our recommended stop-loss: $28.03 (-4.39%) (This stock has medium daily movements and this gives medium risk. There is a sell signal from a pivot top found 9 days ago.)
Trading Expectations (AE) For The Upcoming Trading Day Of Monday 22nd
For the upcoming trading day on Monday, 22nd we expect Adams Resources & Energy Inc to open at $29.21, and during the day (based on 14 day Average True Range), to move between $28.30 and $30.34, which gives a possible trading interval of +/-$1.02 (+/-3.49%) up or down from last closing price. If Adams Resources & Energy Inc takes out the full calculated possible swing range there will be an estimated 6.98% move between the lowest and the highest trading price during the day.
Since the stock is closer to the resistance from accumulated volume at $29.71 (1.33%) than the support at $26.81 (8.56%), our systems don't find the trading risk/reward intra-day attractive and any bets should be held until the stock is closer to the support level.
Is Adams Resources & Energy Inc stock A Buy?
Several short-term signals, along with a general good trend, are positive and we conclude that the current level may hold a buying opportunity as there is a fair chance for Adams Resources & Energy Inc stock to perform well in the short-term.
Current score: 3.359 Buy Candidate Unchanged
Predicted Opening Price for Adams Resources & Energy Inc of Monday, April 22, 2024
| Fair opening price April 22, 2024 | Current price |
|---|---|
| $29.21 ( 0.375%) | $29.32 |
The predicted opening price is based on yesterday's movements between high, low, and closing price.
Trading levels for AE
Fibonacci Support & Resistance Levels
| Level | Price | |||
|---|---|---|---|---|
| Resistance | R3 | 29.60 | 0.95 % | |
| R2 | 29.45 | 0.447 % | ||
| R1 | 29.36 | 0.133 % | ||
| Current price: | 29.32 | |||
| Support | S1 | 29.06 | -0.88 % | |
| S2 | 28.97 | -1.20 % | ||
| S3 | 28.82 | -1.71 % |
Accumulated Volume Support & Resistance Levels
| Level | Price | |||
|---|---|---|---|---|
| Resistance | R3 | 30.03 | 2.42 % | |
| R2 | 29.89 | 1.94 % | ||
| R1 | 29.71 | 1.33 % | ||
| Current price | 29.32 | |||
| Support | S1 | 26.81 | -8.56% | |
| S2 | 24.55 | -16.27% | ||
| S3 | 24.00 | -18.14% |
AE Dividend Payout History
| # | Ex-Date | Pay Date | Amount | Yield | |
|---|---|---|---|---|---|
| 1 | Feb 21, 2024 | Mar 07, 2024 | Mar 22, 2024 | $0.240 | 0.93% |
| 2 | Nov 30, 2023 | Nov 30, 2023 | Dec 15, 2023 | $0.240 | 0.92% |
| 3 | Aug 09, 2023 | Sep 07, 2023 | Sep 22, 2023 | $0.240 | 0.683% |
| 4 | May 09, 2023 | Jun 08, 2023 | Jun 23, 2023 | $0.240 | 0.695% |
| 5 | Feb 21, 2023 | Mar 09, 2023 | Mar 24, 2023 | $0.240 | 0.633% |
FAQ
Click here for our free guide on how to buy Adams Resources & Energy Inc Stock.