Alico Stock Forecast
Evaluation of Alico stock downgraded after the last trading session.
(Updated on Apr 24, 2024)
The Alico stock price fell by -0.92% on the last day (Wednesday, 24th Apr 2024) from $28.28 to $28.02. During the last trading day the stock fluctuated 1.39% from a day low at $27.88 to a day high of $28.26. The price has fallen in 6 of the last 10 days and is down by -1.79% for this period. Volume has increased on the last day by 2 thousand shares but on falling prices. This may be an early warning and the risk will be increased slightly over the next couple of days. In total, 11 thousand shares were bought and sold for approximately $311.22 thousand.
The stock lies in the middle of a wide and falling trend in the short term and further fall within the trend is signaled. Given the current short-term trend, the stock is expected to fall -3.42% during the next 3 months and, with a 90% probability hold a price between $25.30 and $28.46 at the end of this 3-month period.
Ready to grow your portfolio? Here's your beginner's guide to opening a free brokerage account.
ALCO Signals & Forecast
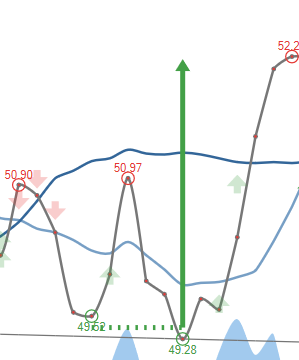
There are mixed signals in the stock today. The Alico stock holds a buy signal from the short-term Moving Average; at the same time, however, the long-term average holds a general sell signal. Since the longterm average is above the short-term average there is a general sell signal in the stock giving a more negative forecast for the stock. On further gains, the stock will meet resistance from the long-term Moving Average at $28.12. On a fall, the stock will find some support from the short-term average at $27.52. A break-up through the long-term average will give another buy signal, while a fall below the short-term average will add another sell signal and strengthen the general signal. Furthermore, there is currently a sell signal from the 3 month Moving Average Convergence Divergence (MACD). Alico gained volume on the last day, but on falling prices. In technical terms, this is called divergence and may be an early warning. In some cases, increasing volume on falling prices may be considered positive, but that is mainly in typical "sell-offs". A buy signal was issued from a pivot bottom point on Wednesday, April 17, 2024, and so far it has risen 5.14%. Further rise is indicated until a new top pivot has been found.
 A buy signal from a double bottom formation was found on Wednesday, April 17, 2024 and based on theory for this formation the price should go up by 7.79% to $30.20 within 26 trading days since signal was issued (Thursday, April 25, 2024).
Support, Risk & Stop-loss for Alico stock
Alico finds support from accumulated volume at $27.51 and this level may hold a buying opportunity as an upwards reaction can be expected when the support is being tested.
This stock has average movements during the day and with good trading volume, the risk is considered to be medium. During the last day, the stock moved $0.388 between high and low, or 1.39%. For the last week, the stock has had daily average volatility of 2.34%.
Our recommended stop-loss: We hold a negative evaluation for this stock. No stop-loss is set.
Trading Expectations (ALCO) For The Upcoming Trading Day Of Thursday 25th
For the upcoming trading day on Thursday, 25th we expect Alico to open at $28.05, and during the day (based on 14 day Average True Range), to move between $27.33 and $28.71, which gives a possible trading interval of +/-$0.693 (+/-2.47%) up or down from last closing price. If Alico takes out the full calculated possible swing range there will be an estimated 4.95% move between the lowest and the highest trading price during the day.
Since the stock is closer to the resistance from accumulated volume at $28.32 (1.07%) than the support at $27.51 (1.82%), our systems don't find the trading risk/reward intra-day attractive and any bets should be held until the stock is closer to the support level.
Is Alico stock A Buy?
Alico holds several negative signals and we believe that it will still perform weakly in the next couple of days or weeks. We, therefore, hold a negative evaluation of this stock. Due to some small weaknesses in the technical picture we have downgraded our analysis conclusion for this stock since the last evaluation from a Hold/Accumulate to a Sell candidate.
Current score: -1.848 Sell Candidate Downgraded
Predicted Opening Price for Alico of Thursday, April 25, 2024
| Fair opening price April 25, 2024 | Current price |
|---|---|
| $28.05 ( 0.116%) | $28.02 |
The predicted opening price is based on yesterday's movements between high, low, and closing price.
Trading levels for ALCO
Fibonacci Support & Resistance Levels
| Level | Price | |||
|---|---|---|---|---|
| Resistance | R3 | 28.44 | 1.50 % | |
| R2 | 28.29 | 0.97 % | ||
| R1 | 28.20 | 0.645 % | ||
| Current price: | 28.02 | |||
| Support | S1 | 27.90 | -0.412 % | |
| S2 | 27.81 | -0.739 % | ||
| S3 | 27.66 | -1.27 % |
Accumulated Volume Support & Resistance Levels
| Level | Price | |||
|---|---|---|---|---|
| Resistance | R3 | 30.48 | 8.78 % | |
| R2 | 28.63 | 2.18 % | ||
| R1 | 28.32 | 1.07 % | ||
| Current price | 28.02 | |||
| Support | S1 | 27.51 | -1.82% | |
| S2 | 27.36 | -2.36% | ||
| S3 | 27.11 | -3.25% |
ALCO Dividend Payout History
| # | Ex-Date | Pay Date | Amount | Yield | |
|---|---|---|---|---|---|
| 1 | Mar 14, 2024 | Mar 27, 2024 | Apr 11, 2024 | $0.0500 | 0.176% |
| 2 | Dec 08, 2023 | Dec 28, 2023 | Jan 12, 2024 | $0.0500 | 0.177% |
| 3 | Sep 15, 2023 | Sep 28, 2023 | Oct 13, 2023 | $0.0500 | 0.205% |
| 4 | Jun 15, 2023 | Jun 29, 2023 | Jul 14, 2023 | $0.0500 | 0.195% |
| 5 | Mar 10, 2023 | Mar 30, 2023 | Apr 14, 2023 | $0.0500 | 0.207% |
FAQ
Click here for our free guide on how to buy Alico Stock.