Ameresco Inc Stock Forecast
Ameresco Inc stock price ended at $18.56 on Thursday, after losing 0.269%.
(Updated on Apr 18, 2024)
The Ameresco Inc stock price fell by -0.269% on the last day (Thursday, 18th Apr 2024) from $18.61 to $18.56. It has now fallen 7 days in a row. During the last trading day the stock fluctuated 4.67% from a day low at $18.32 to a day high of $19.17. The price has fallen in 8 of the last 10 days and is down by -18.56% for this period. Volume fell on the last day along with the stock, which is actually a good sign as volume should follow the stock. On the last day, the trading volume fell by -92 thousand shares and in total, 429 thousand shares were bought and sold for approximately $7.97 million.
The stock lies in the lower of a very wide and falling trend in the short term, and this may normally pose a very good buying opportunity. If the lower trend floor at $17.64 is broken, it will firstly indicate a stronger fall rate. Given the current short-term trend, the stock is expected to fall -3.57% during the next 3 months and, with a 90% probability hold a price between $17.01 and $23.91 at the end of this 3-month period.
Ready to grow your portfolio? Here's your beginner's guide to opening a free brokerage account.
AMRC Signals & Forecast
There are few to no technical positive signals at the moment. The Ameresco Inc stock holds sell signals from both short and long-term Moving Averages giving a more negative forecast for the stock. Also, there is a general sell signal from the relation between the two signals where the long-term average is above the short-term average. On corrections up, there will be some resistance from the lines at $20.48 and $21.11. A break-up above any of these levels will issue buy signals. A sell signal was issued from a pivot top point on Monday, April 01, 2024, and so far it has fallen -25.73%. Further fall is indicated until a new bottom pivot has been found. Furthermore, there is currently a sell signal from the 3 month Moving Average Convergence Divergence (MACD). Volume fell together with the price during the last trading day and this reduces the overall risk as volume should follow the price movements.
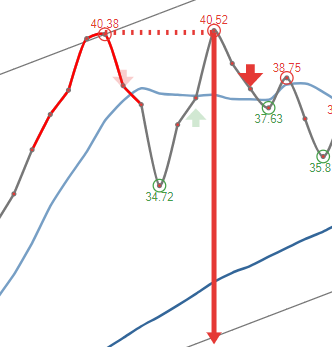 A sell signal from a double top formation was found on Monday, April 01, 2024 and based on theory for this formation the price should fall by -28.75% to $13.22 within 33 trading days since signal was issued (Friday, April 19, 2024).
Support, Risk & Stop-loss for Ameresco Inc stock
Ameresco Inc finds support from accumulated volume at $18.47 and this level may hold a buying opportunity as an upwards reaction can be expected when the support is being tested.
This stock may move much during the day (volatility) and with a large prediction interval from the Bollinger Band this stock is considered to be "high risk". During the last day, the stock moved $0.86 between high and low, or 4.67%. For the last week, the stock has had daily average volatility of 6.26%.
Ameresco Inc is oversold on RSI14 (24). Some stocks may drop long and hard while being oversold on RSI before turning, which increases the general risk.
Our recommended stop-loss: We hold a negative evaluation for this stock. No stop-loss is set.
Trading Expectations (AMRC) For The Upcoming Trading Day Of Friday 19th
For the upcoming trading day on Friday, 19th we expect Ameresco Inc to open at $18.68, and during the day (based on 14 day Average True Range), to move between $17.14 and $19.98, which gives a possible trading interval of +/-$1.42 (+/-7.66%) up or down from last closing price. If Ameresco Inc takes out the full calculated possible swing range there will be an estimated 15.32% move between the lowest and the highest trading price during the day.
Since the stock is closer to the support from accumulated volume at $18.47 (0.48%) than the resistance at $19.54 (5.28%), our systems sees the trading risk/reward intra-day as attractive and believe profit can be made before the stock reaches first resistance..
Is Ameresco Inc stock A Buy?
Ameresco Inc holds several negative signals and is within a very wide and falling trend, so we believe it will still perform weakly in the next couple of days or weeks. We therefore hold a negative evaluation of this stock.
Current score: -2.879 Sell Candidate Unchanged
Predicted Opening Price for Ameresco Inc of Friday, April 19, 2024
| Fair opening price April 19, 2024 | Current price |
|---|---|
| $18.68 ( 0.656%) | $18.56 |
The predicted opening price is based on yesterday's movements between high, low, and closing price.
Trading levels for AMRC
Fibonacci Support & Resistance Levels
| Level | Price | |||
|---|---|---|---|---|
| Resistance | R3 | 19.54 | 5.26 % | |
| R2 | 19.21 | 3.50 % | ||
| R1 | 19.01 | 2.42 % | ||
| Current price: | 18.56 | |||
| Support | S1 | 18.36 | -1.10 % | |
| S2 | 18.15 | -2.19 % | ||
| S3 | 17.83 | -3.95 % |
Accumulated Volume Support & Resistance Levels
| Level | Price | |||
|---|---|---|---|---|
| Resistance | R3 | 20.96 | 12.93 % | |
| R2 | 20.11 | 8.35 % | ||
| R1 | 19.54 | 5.28 % | ||
| Current price | 18.56 | |||
| Support | S1 | 18.47 | -0.485% | |
| S2 | 18.11 | -2.42% | ||
| S3 | 0 | . |
FAQ
Click here for our free guide on how to buy Ameresco Inc Stock.