Associated Banc-Corp Stock Forecast
Associated Banc-Corp stock price up 0.329% on Wednesday
(Updated on Apr 24, 2024)
The Associated Banc-Corp stock price gained 0.329% on the last trading day (Wednesday, 24th Apr 2024), rising from $21.27 to $21.34. It has now gained 6 days in a row. It is not often that stocks manage to gain so many days in a row, and falls for a day or two should be expected. During the last trading day the stock fluctuated 2.08% from a day low at $20.95 to a day high of $21.39. The price has risen in 6 of the last 10 days and is up by 3.64% over the past 2 weeks. Volume has increased on the last day along with the price, which is a positive technical sign, and, in total, 152 thousand more shares were traded than the day before. In total, 2 million shares were bought and sold for approximately $35.21 million.
The stockis at the upper part of a horizontal trend and normally this may pose a good selling opportunity but a break-up through the top trend line at $21.49 will give a strong buy signal and a trend shift could be expected. Given the current horizontal trend, you can expect Associated Banc-Corp stock with a 90% probability to be traded between $19.61 and $21.42 at the end of this 3-month period. A break of a horizontal trend is often followed by a large increase in the volume, and stocks seldom manage to go directly from the bottom of a trend up to the top. Stocks turning up in the middle of a horizontal trend are therefore considered to be potential runners.
Ready to grow your portfolio? Here's your beginner's guide to opening a free brokerage account.
ASB Signals & Forecast
The Associated Banc-Corp stock holds buy signals from both short and long-term Moving Averages giving a positive forecast for the stock, but the stock has a general sell signal from the relation between the two signals where the long-term average is above the short-term average. On corrections down, there will be some support from the lines at $20.58 and $20.76. A breakdown below any of these levels will issue sell signals. A buy signal was issued from a pivot bottom point on Tuesday, April 16, 2024, and so far it has risen 7.24%. Further rise is indicated until a new top pivot has been found. Volume is rising along with the price. This is considered to be a good technical signal. Some negative signals were issued as well, and these may have some influence on the near short-term development. Furthermore, there is currently a sell signal from the 3 month Moving Average Convergence Divergence (MACD).
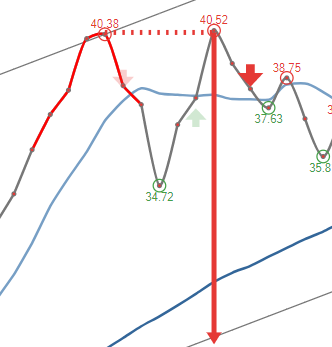 A sell signal from a double top formation was found on Thursday, March 28, 2024 and based on theory for this formation the price should fall by -12.54% to $18.66 within 17 trading days since signal was issued (Thursday, April 25, 2024).
Support, Risk & Stop-loss for Associated Banc-Corp stock
Associated Banc-Corp finds support from accumulated volume at $21.01 and this level may hold a buying opportunity as an upwards reaction can be expected when the support is being tested.
This stock is usually traded at a good volume, and with minor daily changes, the risk is considered to be low. During the last day, the stock moved $0.435 (2.08%) between high and low. For the last week, the stock has had daily average volatility of 2.64%.
Since the Associated Banc-Corp has been rising for 6 days in a row, the risk over the next couple of days has increased. We don't expect a major reaction as the stock is in very good shape technically, and therefore hold a positive evaluation despite the very short term risk.
Our recommended stop-loss: $20.51 (-3.90%) (This stock has low daily movements and this gives low risk. There is a buy signal from a pivot bottom found 6 days ago.)
Trading Expectations (ASB) For The Upcoming Trading Day Of Thursday 25th
For the upcoming trading day on Thursday, 25th we expect Associated Banc-Corp to open at $21.23, and during the day (based on 14 day Average True Range), to move between $20.82 and $21.86, which gives a possible trading interval of +/-$0.516 (+/-2.42%) up or down from last closing price. If Associated Banc-Corp takes out the full calculated possible swing range there will be an estimated 4.84% move between the lowest and the highest trading price during the day.
Since the stock is closer to the resistance from accumulated volume at $21.51 (0.80%) than the support at $21.01 (1.55%), our systems don't find the trading risk/reward intra-day attractive and any bets should be held until the stock is closer to the support level.
Earnings coming up
Associated Banc-Corp will release earnings AMC on Thursday, April 25, 2024.The consensus among the analysts for the expected earnings (EPS) is $0.490. We will update the financials statements for Associated Banc-Corp, that can be found here as soon as the records are public. Our systems has calculated a possible swing of +/- 2.81% in the first trading day after earnings release.
Is Associated Banc-Corp stock A Buy?
Several short-term signals are positive and we conclude that the current level may hold a buying opportunity, as there is a fair chance for Associated Banc-Corp stock to perform well in the short-term period.
Current score: 1.241 Buy Candidate Unchanged
Predicted Opening Price for Associated Banc-Corp of Thursday, April 25, 2024
| Fair opening price April 25, 2024 | Current price |
|---|---|
| $21.23 ( 0.539%) | $21.34 |
The predicted opening price is based on yesterday's movements between high, low, and closing price.
Trading levels for ASB
Fibonacci Support & Resistance Levels
| Level | Price | |||
|---|---|---|---|---|
| Resistance | R3 | 21.66 | 1.50 % | |
| R2 | 21.49 | 0.721 % | ||
| R1 | 21.39 | 0.240 % | ||
| Current price: | 21.34 | |||
| Support | S1 | 21.06 | -1.32 % | |
| S2 | 20.96 | -1.80 % | ||
| S3 | 20.79 | -2.58 % |
Accumulated Volume Support & Resistance Levels
| Level | Price | |||
|---|---|---|---|---|
| Resistance | R3 | 21.88 | 2.53 % | |
| R2 | 21.65 | 1.45 % | ||
| R1 | 21.51 | 0.797 % | ||
| Current price | 21.34 | |||
| Support | S1 | 21.01 | -1.55% | |
| S2 | 20.84 | -2.34% | ||
| S3 | 20.54 | -3.75% |
ASB Dividend Payout History
| # | Ex-Date | Pay Date | Amount | Yield | |
|---|---|---|---|---|---|
| 1 | Feb 29, 2024 | Feb 29, 2024 | Mar 15, 2024 | $0.220 | 1.09% |
| 2 | Oct 25, 2023 | Nov 30, 2023 | Dec 15, 2023 | $0.220 | 1.04% |
| 3 | Jul 25, 2023 | Aug 31, 2023 | Sep 15, 2023 | $0.210 | 1.19% |
| 4 | Apr 25, 2023 | May 31, 2023 | Jun 15, 2023 | $0.210 | 1.22% |
| 5 | Feb 01, 2023 | Feb 28, 2023 | Mar 15, 2023 | $0.210 | 1.09% |
FAQ
Click here for our free guide on how to buy Associated Banc-Corp Stock.