Chemring Group PLC Stock Forecast
Chemring Group PLC stock price up more than 5.38% on Monday
(Updated on Apr 22, 2024)
The Chemring Group PLC stock price gained 5.38% on the last trading day (Monday, 22nd Apr 2024), rising from £344.00 to £362.50. During the last trading day the stock fluctuated 4.31% from a day low at £349.00 to a day high of £364.05. The price has risen in 5 of the last 10 days and is up by 0.55% over the past 2 weeks. Volume has increased on the last day along with the price, which is a positive technical sign, and, in total, 402 thousand more shares were traded than the day before. In total, 650 thousand shares were bought and sold for approximately £235.53 million.
The stockis at the upper part of a horizontal trend and normally this may pose a good selling opportunity but a break-up through the top trend line at £364.61 will give a strong buy signal and a trend shift could be expected. Given the current horizontal trend, you can expect Chemring Group PLC stock with a 90% probability to be traded between £346.07 and £367.90 at the end of this 3-month period. A break of a horizontal trend is often followed by a large increase in the volume, and stocks seldom manage to go directly from the bottom of a trend up to the top. Stocks turning up in the middle of a horizontal trend are therefore considered to be potential runners.
Ready to grow your portfolio? Here's your beginner's guide to opening a free brokerage account.
CHG.L Signals & Forecast
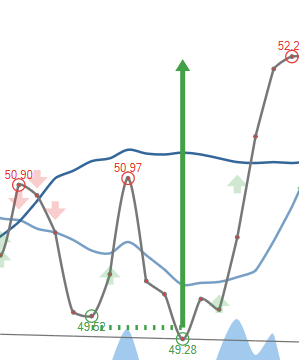
The Chemring Group PLC stock holds buy signals from both short and long-term Moving Averages giving a positive forecast for the stock, but the stock has a general sell signal from the relation between the two signals where the long-term average is above the short-term average. On corrections down, there will be some support from the lines at £352.64 and £354.83. A breakdown below any of these levels will issue sell signals. A buy signal was issued from a pivot bottom point on Thursday, April 18, 2024, and so far it has risen 5.53%. Further rise is indicated until a new top pivot has been found. Volume is rising along with the price. This is considered to be a good technical signal. Some negative signals were issued as well, and these may have some influence on the near short-term development. Furthermore, there is currently a sell signal from the 3 month Moving Average Convergence Divergence (MACD).
 A buy signal from a double bottom formation was found on Thursday, April 18, 2024 and based on theory for this formation the price should go up by 1.81% to £369.07 within 7 trading days since signal was issued (Tuesday, April 23, 2024).
Support, Risk & Stop-loss for Chemring Group PLC stock
Chemring Group PLC finds support from accumulated volume at £353.50 and this level may hold a buying opportunity as an upwards reaction can be expected when the support is being tested.
This stock is usually traded at a good volume, and with minor daily changes, the risk is considered to be low. During the last day, the stock moved £15.05 (4.31%) between high and low. For the last week, the stock has had daily average volatility of 3.66%.
Our recommended stop-loss: £347.97 (-4.01%) (This stock has low daily movements and this gives low risk. There is a buy signal from a pivot bottom found 2 days ago.)
Trading Expectations (CHG.L) For The Upcoming Trading Day Of Tuesday 23rd
For the upcoming trading day on Tuesday, 23rd we expect Chemring Group PLC to open at £358.52, and during the day (based on 14 day Average True Range), to move between £349.47 and £375.53, which gives a possible trading interval of +/-£13.03 (+/-3.59%) up or down from last closing price. If Chemring Group PLC takes out the full calculated possible swing range there will be an estimated 7.19% move between the lowest and the highest trading price during the day.
Since the stock is closer to the resistance from accumulated volume at £363.00 (0.14%) than the support at £353.50 (2.48%), our systems don't find the trading risk/reward intra-day attractive and any bets should be held until the stock is closer to the support level.
Is Chemring Group PLC stock A Buy?
Several short-term signals are positive and we conclude that the current level may hold a buying opportunity, as there is a fair chance for Chemring Group PLC stock to perform well in the short-term period. We have upgraded our analysis conclusion for this stock since the last evaluation from a Hold/Accumulate to a Buy candidate.
Current score: 1.670 Buy Candidate Upgraded
Predicted Opening Price for Chemring Group PLC of Tuesday, April 23, 2024
| Fair opening price April 23, 2024 | Current price |
|---|---|
| £358.52 ( 1.10%) | £362.50 |
The predicted opening price is based on yesterday's movements between high, low, and closing price.
Trading levels for CHG.L
Fibonacci Support & Resistance Levels
| Level | Price | |||
|---|---|---|---|---|
| Resistance | R3 | 373.57 | 3.05 % | |
| R2 | 367.82 | 1.47 % | ||
| R1 | 364.27 | 0.487 % | ||
| Current price: | 362.50 | |||
| Support | S1 | 352.77 | -2.68 % | |
| S2 | 349.22 | -3.66 % | ||
| S3 | 343.47 | -5.25 % |
Accumulated Volume Support & Resistance Levels
| Level | Price | |||
|---|---|---|---|---|
| Resistance | R3 | 0 | . | |
| R2 | 363.50 | 0.276 % | ||
| R1 | 363.00 | 0.138 % | ||
| Current price | 362.50 | |||
| Support | S1 | 353.50 | -2.48% | |
| S2 | 353.00 | -2.62% | ||
| S3 | 347.00 | -4.28% |
CHG Dividend Payout History
| # | Ex-Date | Pay Date | Amount | Yield | |
|---|---|---|---|---|---|
| 1 | Mar 21, 2024 | Mar 21, 2024 | Mar 21, 2024 | £0 | 0% |
| 2 | Dec 13, 2022 | Mar 23, 2023 | Apr 14, 2023 | £3.80 | 1.31% |
| 3 | Jun 08, 2022 | Aug 18, 2022 | Sep 09, 2022 | £1.90 | 0.634% |
| 4 | Dec 14, 2021 | Mar 10, 2022 | Mar 31, 2022 | £3.20 | 0.98% |
| 5 | Jun 03, 2021 | Aug 19, 2021 | Sep 10, 2021 | £1.60 | 0.497% |
FAQ
Click here for our free guide on how to buy Chemring Group PLC Stock.