CMC Markets Plc Stock Forecast
Explanation to Bollinger's Bands
Bollinger Bands was created by John Bollinger in the early 1980s, its purpose is to define price action relative to the assets highs and lows. This technical indicator is used to identify buy and sell signals and has proven very well in doing so.
Bollinger Bands consist of a set of three curves drawn in relation to securities prices. The middle band is a measure of the intermediate-term trend, usually a simple moving average, that serves as the base for the upper and lower bands. The interval between the upper and lower bands and the middle band is determined by volatility, typically the standard deviation of the same data that were used for the average. StockInvest.us uses Bollingers suggested 20 day average.
Middle Bollinger Band = 20-period simple moving average
Upper Bollinger Band = Middle Bollinger Band + 2 * 20-period standard deviation
Lower Bollinger Band = Middle Bollinger Band - 2 * 20-period standard deviation
BandWidth defines the current width of the band.
%b defines the current position within the band.
BandWidth = (Upper Bollinger Band - Lower Bollinger Band) / Middle Bollinger Band
%b = (Last - Lower Bollinger Band) / (Upper Bollinger Band - Lower Bollinger Band)
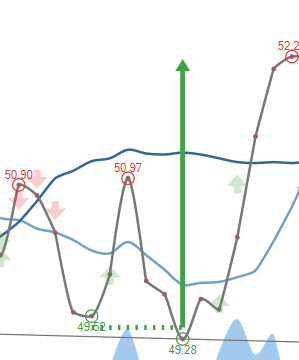
Live Samples:
Bottlenecks in bandwidth indicate an upcoming change. Break up through the moving average line or continuous movements above the moving average line indicate a break up, and vice versa.
Source: http://www.bollingerbands.com
Weaker technical forecast for CMC Markets Plc as stock downgraded to Hold/Accumulate.
(Updated on Apr 22, 2024)
The CMC Markets Plc stock price gained 1.21% on the last trading day (Monday, 22nd Apr 2024), rising from £247.50 to £250.50. During the last trading day the stock fluctuated 3.20% from a day low at £244.66 to a day high of £252.50. The price has risen in 4 of the last 10 days and is up by 3.94% over the past 2 weeks. Volume has increased on the last day along with the price, which is a positive technical sign, and, in total, 360 thousand more shares were traded than the day before. In total, 360 thousand shares were bought and sold for approximately £90.27 million.
The stock lies in the upper part of a wide and strong rising trend in the short term, and this may normally pose a very good selling opportunity for the short-term trader as reaction back towards the lower part of the trend can be expected. A break-up at the top trend line at £253.01 will firstly indicate a stronger rate of rising. Given the current short-term trend, the stock is expected to rise 79.28% during the next 3 months and, with a 90% probability hold a price between £381.74 and £453.61 at the end of this 3-month period.
Ready to grow your portfolio? Here's your beginner's guide to opening a free brokerage account.
CMCX.L Signals & Forecast
The CMC Markets Plc stock holds buy signals from both short and long-term Moving Averages giving a positive forecast for the stock. Also, there is a general buy signal from the relation between the two signals where the short-term average is above the long-term average. On corrections down, there will be some support from the lines at £243.29 and £203.48. A breakdown below any of these levels will issue sell signals. A buy signal was issued from a pivot bottom point on Tuesday, March 12, 2024, and so far it has risen 52.56%. Further rise is indicated until a new top pivot has been found. Volume is rising along with the price. This is considered to be a good technical signal. Some negative signals were issued as well, and these may have some influence on the near short-term development. Furthermore, there is currently a sell signal from the 3 month Moving Average Convergence Divergence (MACD).
 A buy signal from a double bottom formation was found on Tuesday, March 12, 2024 with a target of £168.72. Despite whether the objective of the signal formation has been reached the stock may continue to perform well.
Support, Risk & Stop-loss for CMC Markets Plc stock
CMC Markets Plc finds support from accumulated volume at £241.00 and this level may hold a buying opportunity as an upwards reaction can be expected when the support is being tested.
This stock may move much during the day (volatility) and with a large prediction interval from the Bollinger Band this stock is considered to be "high risk". During the last day, the stock moved £7.84 between high and low, or 3.20%. For the last week, the stock has had daily average volatility of 2.54%.
The CMC Markets Plc stock is overbought on RSI14 and lies in the upper part of the trend. Normally this may pose a good selling opportunity for the short-term trader, but some stocks may go long and hard while being overbought and the RSI is still moving upwards. Regardless, the high RSI together with the trend position increases the risk and higher daily movements (volatility) should be expected. A correction down in the nearby future seems very likely, and it is of great importance that the stock manages to break the trend before that occurs.
Our recommended stop-loss: £242.18 (-3.32%) (This stock has high daily movements and this gives high risk. The RSI14 is 84 and this increases the risk substantially. There is a buy signal from a pivot bottom found 27 days ago.)
Trading Expectations (CMCX.L) For The Upcoming Trading Day Of Tuesday 23rd
For the upcoming trading day on Tuesday, 23rd we expect CMC Markets Plc to open at £249.22, and during the day (based on 14 day Average True Range), to move between £242.88 and £258.12, which gives a possible trading interval of +/-£7.62 (+/-3.04%) up or down from last closing price. If CMC Markets Plc takes out the full calculated possible swing range there will be an estimated 6.08% move between the lowest and the highest trading price during the day.
With no resistance above and support from accumulated volume @ £241.00, some £9.50 (3.79%) from the current price of £250.50, our system finds the risk reward attractive.
Is CMC Markets Plc stock A Buy?
CMC Markets Plc holds several positive signals, but we still don't find these to be enough for a buy candidate. At the current level, it should be considered as a hold candidate (hold or accumulate) in this position whilst awaiting further development. Due to some small weaknesses in the technical picture we have downgraded our analysis conclusion for this stock since the last evaluation from a Buy to a Hold/Accumulate candidate.
Current score: 0.000 Hold/Accumulate Downgraded
Zero in score indicates that our system is expecting high volatility and risk for the following trading day. Given the latest developments, we cannot determine the next direction as it may go both ways.
Predicted Opening Price for CMC Markets Plc of Tuesday, April 23, 2024
| Fair opening price April 23, 2024 | Current price |
|---|---|
| £249.22 ( 0.511%) | £250.50 |
The predicted opening price is based on yesterday's movements between high, low, and closing price.
Trading levels for CMCX.L
Fibonacci Support & Resistance Levels
| Level | Price | |||
|---|---|---|---|---|
| Resistance | R3 | 257.06 | 2.62 % | |
| R2 | 254.07 | 1.42 % | ||
| R1 | 252.21 | 0.685 % | ||
| Current price: | 250.50 | |||
| Support | S1 | 246.23 | -1.71 % | |
| S2 | 244.37 | -2.45 % | ||
| S3 | 241.38 | -3.64 % |
Accumulated Volume Support & Resistance Levels
| Level | Price | |||
|---|---|---|---|---|
| Resistance | R3 | 0 | . | |
| R2 | 0 | . | ||
| R1 | 0 | . | ||
| Current price | 250.50 | |||
| Support | S1 | 241.00 | -3.79% | |
| S2 | 238.00 | -4.99% | ||
| S3 | 219.50 | -12.38% |
CMCX Dividend Payout History
| # | Ex-Date | Pay Date | Amount | Yield | |
|---|---|---|---|---|---|
| 1 | Dec 07, 2023 | Dec 07, 2023 | Dec 07, 2023 | £0 | 0% |
| 2 | Jul 13, 2023 | Jul 13, 2023 | Jul 13, 2023 | £3.90 | 2.47% |
| 3 | Nov 16, 2022 | Dec 01, 2022 | Jan 05, 2023 | £3.50 | 1.50% |
| 4 | Jun 09, 2022 | Jul 14, 2022 | Aug 11, 2022 | £8.88 | 3.46% |
| 5 | Jun 09, 2022 | Jul 13, 2022 | Aug 11, 2022 | £8.88 | 3.46% |
FAQ
Click here for our free guide on how to buy CMC Markets Plc Stock.