CenterPoint Energy Inc Stock Forecast
Explanation to Bollinger's Bands
Bollinger Bands was created by John Bollinger in the early 1980s, its purpose is to define price action relative to the assets highs and lows. This technical indicator is used to identify buy and sell signals and has proven very well in doing so.
Bollinger Bands consist of a set of three curves drawn in relation to securities prices. The middle band is a measure of the intermediate-term trend, usually a simple moving average, that serves as the base for the upper and lower bands. The interval between the upper and lower bands and the middle band is determined by volatility, typically the standard deviation of the same data that were used for the average. StockInvest.us uses Bollingers suggested 20 day average.
Middle Bollinger Band = 20-period simple moving average
Upper Bollinger Band = Middle Bollinger Band + 2 * 20-period standard deviation
Lower Bollinger Band = Middle Bollinger Band - 2 * 20-period standard deviation
BandWidth defines the current width of the band.
%b defines the current position within the band.
BandWidth = (Upper Bollinger Band - Lower Bollinger Band) / Middle Bollinger Band
%b = (Last - Lower Bollinger Band) / (Upper Bollinger Band - Lower Bollinger Band)
Live Samples:
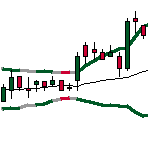
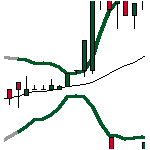
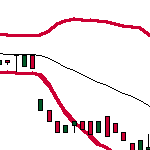
Bottlenecks in bandwidth indicate an upcoming change. Break up through the moving average line or continuous movements above the moving average line indicate a break up, and vice versa.
Source: http://www.bollingerbands.com
CenterPoint Energy Inc stock upgraded to Hold/Accumulate.
(Updated on Apr 19, 2024)
The CenterPoint Energy Inc stock price gained 2.08% on the last trading day (Friday, 19th Apr 2024), rising from $27.95 to $28.53. It has now gained 3 days in a row. It will be exciting to see whether it manages to continue gaining or take a minor break for the next few days. During the last trading day the stock fluctuated 1.93% from a day low at $27.99 to a day high of $28.53. The price has risen in 6 of the last 10 days and is up by 1.71% over the past 2 weeks. Volume has increased on the last day along with the price, which is a positive technical sign, and, in total, 318 thousand more shares were traded than the day before. In total, 3 million shares were bought and sold for approximately $76.08 million.
The stockis at the upper part of a horizontal trend and normally this may pose a good selling opportunity but a break-up through the top trend line at $28.69 will give a strong buy signal and a trend shift could be expected. Given the current horizontal trend, you can expect CenterPoint Energy Inc stock with a 90% probability to be traded between $27.58 and $29.05 at the end of this 3-month period. A break of a horizontal trend is often followed by a large increase in the volume, and stocks seldom manage to go directly from the bottom of a trend up to the top. Stocks turning up in the middle of a horizontal trend are therefore considered to be potential runners.
Ready to grow your portfolio? Here's your beginner's guide to opening a free brokerage account.
CNP Signals & Forecast
The CenterPoint Energy Inc stock holds buy signals from both short and long-term Moving Averages giving a positive forecast for the stock, but the stock has a general sell signal from the relation between the two signals where the long-term average is above the short-term average. On corrections down, there will be some support from the lines at $27.69 and $27.98. A breakdown below any of these levels will issue sell signals. A buy signal was issued from a pivot bottom point on Tuesday, April 16, 2024, and so far it has risen 4.81%. Further rise is indicated until a new top pivot has been found. Volume is rising along with the price. This is considered to be a good technical signal. Some negative signals were issued as well, and these may have some influence on the near short-term development. Furthermore, there is currently a sell signal from the 3 month Moving Average Convergence Divergence (MACD).
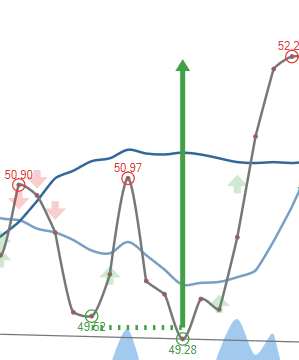 A buy signal from a double bottom formation was found on Tuesday, April 16, 2024 with a target of $27.96. Despite whether the objective of the signal formation has been reached the stock may continue to perform well.
Support, Risk & Stop-loss for CenterPoint Energy Inc stock
CenterPoint Energy Inc finds support from accumulated volume at $27.89 and this level may hold a buying opportunity as an upwards reaction can be expected when the support is being tested.
In general the stock tends to have very controlled movements and with good liquidity the risk is considered very low in this stock. During the last day, the stock moved $0.540 between high and low, or 1.93%. For the last week the stock has had daily average volatility of 1.68%.
Our recommended stop-loss: $27.30 (-4.32%) (This stock has low daily movements and this gives low risk. There is a buy signal from a pivot bottom found 3 days ago.)
Trading Expectations (CNP) For The Upcoming Trading Day Of Monday 22nd
For the upcoming trading day on Monday, 22nd we expect CenterPoint Energy Inc to open at $28.35, and during the day (based on 14 day Average True Range), to move between $28.05 and $29.01, which gives a possible trading interval of +/-$0.482 (+/-1.69%) up or down from last closing price. If CenterPoint Energy Inc takes out the full calculated possible swing range there will be an estimated 3.38% move between the lowest and the highest trading price during the day.
With no resistance above and support from accumulated volume @ $27.89, some $0.640 (2.24%) from the current price of $28.53, our system finds the risk reward attractive.
Is CenterPoint Energy Inc stock A Buy?
CenterPoint Energy Inc holds several positive signals, but we still don't find these to be enough for a buy candidate. At the current level, it should be considered as a hold candidate (hold or accumulate) in this position whilst awaiting further development. We have upgraded our analysis conclusion for this stock since the last evaluation from a Sell to a Hold/Accumulate candidate.
Current score: -0.427 Hold/Accumulate Upgraded
Predicted Opening Price for CenterPoint Energy Inc of Monday, April 22, 2024
| Fair opening price April 22, 2024 | Current price |
|---|---|
| $28.35 ( 0.631%) | $28.53 |
The predicted opening price is based on yesterday's movements between high, low, and closing price.
Trading levels for CNP
Fibonacci Support & Resistance Levels
| Level | Price | |||
|---|---|---|---|---|
| Resistance | R3 | 28.89 | 1.26 % | |
| R2 | 28.68 | 0.539 % | ||
| R1 | 28.56 | 0.0921 % | ||
| Current price: | 28.53 | |||
| Support | S1 | 28.14 | -1.35 % | |
| S2 | 28.02 | -1.80 % | ||
| S3 | 27.81 | -2.52 % |
Accumulated Volume Support & Resistance Levels
| Level | Price | |||
|---|---|---|---|---|
| Resistance | R3 | 0 | . | |
| R2 | 0 | . | ||
| R1 | 0 | . | ||
| Current price | 28.53 | |||
| Support | S1 | 27.89 | -2.24% | |
| S2 | 27.87 | -2.31% | ||
| S3 | 27.50 | -3.61% |
CNP Dividend Payout History
| # | Ex-Date | Pay Date | Amount | Yield | |
|---|---|---|---|---|---|
| 1 | Dec 14, 2023 | Feb 14, 2024 | Mar 14, 2024 | $0.200 | 0.717% |
| 2 | Sep 28, 2023 | Nov 15, 2023 | Dec 14, 2023 | $0.200 | 0.673% |
| 3 | Jul 19, 2023 | Aug 16, 2023 | Sep 14, 2023 | $0.190 | 0.656% |
| 4 | Apr 20, 2023 | May 17, 2023 | Sep 14, 2023 | $0.190 | 0.656% |
| 5 | Dec 15, 2022 | Feb 15, 2023 | Mar 09, 2023 | $0.190 | 0.681% |
FAQ
Click here for our free guide on how to buy CenterPoint Energy Inc Stock.