Donaldson Company, Inc Stock Forecast
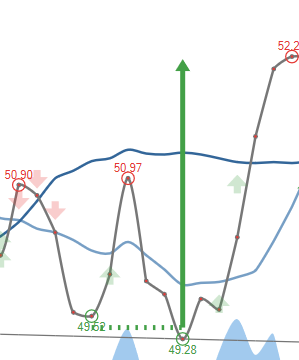
Explanation to Bollinger's Bands
Bollinger Bands was created by John Bollinger in the early 1980s, its purpose is to define price action relative to the assets highs and lows. This technical indicator is used to identify buy and sell signals and has proven very well in doing so.
Bollinger Bands consist of a set of three curves drawn in relation to securities prices. The middle band is a measure of the intermediate-term trend, usually a simple moving average, that serves as the base for the upper and lower bands. The interval between the upper and lower bands and the middle band is determined by volatility, typically the standard deviation of the same data that were used for the average. StockInvest.us uses Bollingers suggested 20 day average.
Middle Bollinger Band = 20-period simple moving average
Upper Bollinger Band = Middle Bollinger Band + 2 * 20-period standard deviation
Lower Bollinger Band = Middle Bollinger Band - 2 * 20-period standard deviation
BandWidth defines the current width of the band.
%b defines the current position within the band.
BandWidth = (Upper Bollinger Band - Lower Bollinger Band) / Middle Bollinger Band
%b = (Last - Lower Bollinger Band) / (Upper Bollinger Band - Lower Bollinger Band)
Live Samples:
Bottlenecks in bandwidth indicate an upcoming change. Break up through the moving average line or continuous movements above the moving average line indicate a break up, and vice versa.
Source: http://www.bollingerbands.com
Volatile ride for Donaldson Company, Inc stock price on Wednesday moving between £0.0300 and £0.0400
(Updated on Sep 02, 2020)
No changes to the price of Donaldson Company, Inc stock on the last trading day (Wednesday, 2nd Sep 2020). During the last trading day the stock fluctuated 33.33% from a day low at £0.0300 to a day high of £0.0400. The price has been going up and down for this period, and there has been a 50% gain for the last 2 weeks.
The stock has broken the narrow and horizontal trend up. Breaks like this are often followed by swift and strong movements, and any correction down to the breakline at approximately. £0 is considered to be a "second chance" to hit a potential runner. It is, however, important that volume does follow the price as false breaks may appear and it may move back into the horizontal trend. Based on the rectangle-formation theory the stock is predicted to reach £0 sometime during the next 3 months.
Ready to grow your portfolio? Here's your beginner's guide to opening a free brokerage account.
DCI.L Signals & Forecast
The Donaldson Company, Inc stock holds buy signals from both short and long-term Moving Averages giving a positive forecast for the stock. Also, there is a general buy signal from the relation between the two signals where the short-term average is above the long-term average. On corrections down, there will be some support from the lines at £0.0300 and £0.0237. A breakdown below any of these levels will issue sell signals. Furthermore, there is a buy signal from the 3 month Moving Average Convergence Divergence (MACD). Some negative signals were issued as well, and these may have some influence on the near short-term development. A sell signal was issued from a pivot top point on Tuesday, November 30, -1. Further fall is indicated until a new bottom pivot has been found. Volume fell on the last day without any changes to the price. This does not cause any direct divergence but may be an early warning and a possible "turning point". The very low volume increases the risk and reduces the other technical signals issued.
Support, Risk & Stop-loss for Donaldson Company, Inc stock
There is no support from accumulated volume below today's level and given the right condition the stock may perform very badly in the next couple of days.
In general the stock tends to have very controlled movements and therefore the general risk is considered very low. However, be aware of low or falling volume and make sure to keep an eye on the stock During the last day, the stock moved £0.0100 between high and low, or 33.33%. For the last week the stock has had daily average volatility of 13.33%
Our recommended stop-loss: £0 (-5.00%) (Unable to calculate.)
Trading Expectations (DCI.L) For The Upcoming Trading Day Of Thursday 3rd
Is Donaldson Company, Inc stock A Buy?
Donaldson Company, Inc holds several positive signals, but we still don't find these to be enough for a buy candidate. At the current level, it should be considered as a hold candidate (hold or accumulate) in this position whilst awaiting further development.
Current score: 0.000 Hold/Accumulate Unchanged
Zero in score indicates that our system is expecting high volatility and risk for the following trading day. Given the latest developments, we cannot determine the next direction as it may go both ways.
Predicted Opening Price for Donaldson Company, Inc of Thursday, September 3, 2020
| Fair opening price September 3, 2020 | Current price |
|---|---|
| £0.0333 ( 11.11%) | £0.0300 |
The predicted opening price is based on yesterday's movements between high, low, and closing price.
Trading levels for DCI.L
Fibonacci Support & Resistance Levels
| Level | Price | |||
|---|---|---|---|---|
| Resistance | R3 | 0.0433 | 44.44 % | |
| R2 | 0.0395 | 31.71 % | ||
| R1 | 0.0372 | 23.84 % | ||
| Current price: | 0.0300 | |||
| Support | S1 | 0.0295 | -1.62 % | |
| S2 | 0.0272 | -9.49 % | ||
| S3 | 0.0233 | -22.22 % |
Accumulated Volume Support & Resistance Levels
| Level | Price | |||
|---|---|---|---|---|
| Resistance | R3 | 0 | . | |
| R2 | 0 | . | ||
| R1 | 0 | . | ||
| Current price | 0.0300 | |||
| Support | S1 | 0 | . | |
| S2 | 0 | . | ||
| S3 | 0 | . |
FAQ
Click here for our free guide on how to buy Donaldson Company, Inc Stock.