Douglas Emmett Inc Stock Forecast
Green day on Thursday for Douglas Emmett Inc
(Updated on Apr 18, 2024)
The Douglas Emmett Inc stock price gained 1.01% on the last trading day (Thursday, 18th Apr 2024), rising from $12.88 to $13.01. During the last trading day the stock fluctuated 2.30% from a day low at $12.82 to a day high of $13.11. The price has risen in 6 of the last 10 days but is still down by -0.46% for this period. Volume has increased on the last day along with the price, which is a positive technical sign, and, in total, 66 thousand more shares were traded than the day before. In total, 1 million shares were bought and sold for approximately $16.96 million.
The stock lies in the middle of a wide and falling trend in the short term and further fall within the trend is signaled. Given the current short-term trend, the stock is expected to fall -4.66% during the next 3 months and, with a 90% probability hold a price between $11.64 and $13.50 at the end of this 3-month period.
Ready to grow your portfolio? Here's your beginner's guide to opening a free brokerage account.
DEI Signals & Forecast
A buy signal was issued from a pivot bottom point on Tuesday, April 16, 2024, and so far it has risen 1.96%. Further rise is indicated until a new top pivot has been found. Volume is rising along with the price. This is considered to be a good technical signal. Some negative signals were issued as well, and these may have some influence on the near short-term development. The Douglas Emmett Inc stock holds sell signals from both short and long-term Moving Averages giving a more negative forecast for the stock. Also, there is a general sell signal from the relation between the two signals where the long-term average is above the short-term average. On corrections up, there will be some resistance from the lines at $13.07 and $13.39. A break-up above any of these levels will issue buy signals. Furthermore, there is currently a sell signal from the 3 month Moving Average Convergence Divergence (MACD).
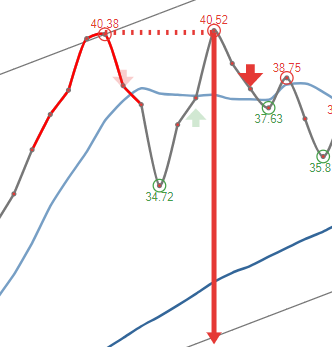 A sell signal from a double top formation was found on Tuesday, April 09, 2024 with a target of $13.07. Despite whether the objective of the signal formation has been reached the stock may continue to fall.
Support, Risk & Stop-loss for Douglas Emmett Inc stock
Douglas Emmett Inc finds support from accumulated volume at $12.88 and this level may hold a buying opportunity as an upwards reaction can be expected when the support is being tested.
This stock has average movements during the day and with good trading volume, the risk is considered to be medium. During the last day, the stock moved $0.295 between high and low, or 2.30%. For the last week, the stock has had daily average volatility of 3.03%.
Our recommended stop-loss: We hold a negative evaluation for this stock. No stop-loss is set.
Trading Expectations (DEI) For The Upcoming Trading Day Of Friday 19th
For the upcoming trading day on Friday, 19th we expect Douglas Emmett Inc to open at $12.98, and during the day (based on 14 day Average True Range), to move between $12.50 and $13.52, which gives a possible trading interval of +/-$0.510 (+/-3.92%) up or down from last closing price. If Douglas Emmett Inc takes out the full calculated possible swing range there will be an estimated 7.84% move between the lowest and the highest trading price during the day.
Since the stock is closer to the support from accumulated volume at $12.88 (1.00%) than the resistance at $13.22 (1.61%), our systems sees the trading risk/reward intra-day as attractive and believe profit can be made before the stock reaches first resistance..
Is Douglas Emmett Inc stock A Buy?
Douglas Emmett Inc holds several negative signals and is within a wide and falling trend, so we believe it will still perform weakly in the next couple of days or weeks. We therefore hold a negative evaluation of this stock.
Current score: -2.149 Sell Candidate Unchanged
Predicted Opening Price for Douglas Emmett Inc of Friday, April 19, 2024
| Fair opening price April 19, 2024 | Current price |
|---|---|
| $12.98 ( 0.243%) | $13.01 |
The predicted opening price is based on yesterday's movements between high, low, and closing price.
Trading levels for DEI
Fibonacci Support & Resistance Levels
| Level | Price | |||
|---|---|---|---|---|
| Resistance | R3 | 13.27 | 2.02 % | |
| R2 | 13.16 | 1.16 % | ||
| R1 | 13.09 | 0.623 % | ||
| Current price: | 13.01 | |||
| Support | S1 | 12.87 | -1.11 % | |
| S2 | 12.80 | -1.64 % | ||
| S3 | 12.68 | -2.51 % |
Accumulated Volume Support & Resistance Levels
| Level | Price | |||
|---|---|---|---|---|
| Resistance | R3 | 14.32 | 10.07 % | |
| R2 | 13.63 | 4.77 % | ||
| R1 | 13.22 | 1.61 % | ||
| Current price | 13.01 | |||
| Support | S1 | 12.88 | -1.00% | |
| S2 | 12.73 | -2.15% | ||
| S3 | 12.71 | -2.31% |
DEI Dividend Payout History
| # | Ex-Date | Pay Date | Amount | Yield | |
|---|---|---|---|---|---|
| 1 | Feb 29, 2024 | Mar 27, 2024 | Apr 16, 2024 | $0.190 | 1.49% |
| 2 | Dec 13, 2023 | Dec 28, 2023 | Jan 17, 2024 | $0.190 | 1.38% |
| 3 | Sep 08, 2023 | Sep 28, 2023 | Oct 17, 2023 | $0.190 | 1.52% |
| 4 | May 24, 2023 | Jun 29, 2023 | Jul 18, 2023 | $0.190 | 1.38% |
| 5 | Mar 02, 2023 | Mar 30, 2023 | Apr 14, 2023 | $0.190 | 1.54% |
FAQ
Click here for our free guide on how to buy Douglas Emmett Inc Stock.