Ultrack Systems Stock Forecast
Explanation to Bollinger's Bands
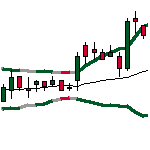
Bollinger Bands was created by John Bollinger in the early 1980s, its purpose is to define price action relative to the assets highs and lows. This technical indicator is used to identify buy and sell signals and has proven very well in doing so.
Bollinger Bands consist of a set of three curves drawn in relation to securities prices. The middle band is a measure of the intermediate-term trend, usually a simple moving average, that serves as the base for the upper and lower bands. The interval between the upper and lower bands and the middle band is determined by volatility, typically the standard deviation of the same data that were used for the average. StockInvest.us uses Bollingers suggested 20 day average.
Middle Bollinger Band = 20-period simple moving average
Upper Bollinger Band = Middle Bollinger Band + 2 * 20-period standard deviation
Lower Bollinger Band = Middle Bollinger Band - 2 * 20-period standard deviation
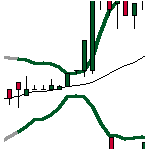
BandWidth defines the current width of the band.
%b defines the current position within the band.
BandWidth = (Upper Bollinger Band - Lower Bollinger Band) / Middle Bollinger Band
%b = (Last - Lower Bollinger Band) / (Upper Bollinger Band - Lower Bollinger Band)
Live Samples:
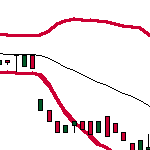
Bottlenecks in bandwidth indicate an upcoming change. Break up through the moving average line or continuous movements above the moving average line indicate a break up, and vice versa.
Source: http://www.bollingerbands.com
Volatile ride for Ultrack Systems stock price on Monday moving between $0.0001 and $0.0002
(Updated on Apr 15, 2024)
The Ultrack Systems stock price gained 33.33% on the last trading day (Monday, 15th Apr 2024), rising from $0.0002 to $0.0002. During the last trading day the stock fluctuated 100.00% from a day low at $0.0001 to a day high of $0.0002. The price has risen in 6 of the last 10 days and is up by 100% over the past 2 weeks. Volume fell on the last day by -14 million shares and in total, 907 thousand shares were bought and sold for approximately $181.30 . You should take into consideration that falling volume on higher prices causes divergence and may be an early warning about possible changes over the next couple of days.
The stockhas broken the very wide and falling short-term trend up. Firstly a slower falling rate is indicated, but this may very well be an early signal of a trend shift. On the reaction, there will be support on the roof of the current trend broken, which is $0.0002, a level that may pose a second chance to hit a runner. According to fan-theory $0.0003 will be the next possible trend-top level and thereby pose a resistance level that may not be broken at the first attempt.
MJLB Signals & Forecast
The Ultrack Systems stock holds buy signals from both short and long-term Moving Averages giving a positive forecast for the stock. Also, there is a general buy signal from the relation between the two signals where the short-term average is above the long-term average. On corrections down, there will be some support from the lines at $0.0001 and $0.0001. A breakdown below any of these levels will issue sell signals. A buy signal was issued from a pivot bottom point on Thursday, April 11, 2024, and so far it has risen 100.00%. Further rise is indicated until a new top pivot has been found. Furthermore, there is a buy signal from the 3 month Moving Average Convergence Divergence (MACD). Some negative signals were issued as well, and these may have some influence on the near short-term development. Volume fell during the last trading day while the price increased. This causes a divergence and may be considered as an early warning, but it may not be. The very low volume increases the risk and reduces the other technical signals issued.
 A buy signal from a double bottom formation was found on Thursday, April 11, 2024 with a target of $0.0001. Despite whether the objective of the signal formation has been reached the stock may continue to perform well.
Support, Risk & Stop-loss for Ultrack Systems stock
There is no support from accumulated volume below today's level and given the right condition the stock may perform very badly in the next couple of days.
This stock may move very much during the day (volatility) and with periodic low trading volume this stock is considered to be "very high risk". During the last day, the stock moved $0.0001 between high and low, or 100.00%. For the last week the stock has had daily average volatility of 38.10%.
Our recommended stop-loss: $0.0002 (-3.42%) (This stock has very high daily movements and this gives very high risk. There is a buy signal from a pivot bottom found 2 days ago.)
Trading Expectations (MJLB) For The Upcoming Trading Day Of Tuesday 16th
For the upcoming trading day on Tuesday, 16th we expect Ultrack Systems to open at $0.0002, and during the day (based on 14 day Average True Range), to move between $0.0001 and $0.0003, which gives a possible trading interval of +/-$0.00007040 (+/-35.20%) up or down from last closing price. If Ultrack Systems takes out the full calculated possible swing range there will be an estimated 70.40% move between the lowest and the highest trading price during the day.
Is Ultrack Systems stock A Buy?
Several short-term signals are positive and the break-up from the falling trend indicates a possible shift for a trend. We believe that the prices around the breaking point will indicate particularly good levels, but we also believe that the current level will hold a possible good buy level for the short-term period.
Current score: 3.372 Buy Candidate Unchanged
Predicted Opening Price for Ultrack Systems of Tuesday, April 16, 2024
| Fair opening price April 16, 2024 | Current price |
|---|---|
| $0.0002 ( 16.67%) | $0.0002 |
The predicted opening price is based on yesterday's movements between high, low, and closing price.
Trading levels for MJLB
Fibonacci Support & Resistance Levels
| Level | Price | |||
|---|---|---|---|---|
| Resistance | R3 | 0.0003 | 33.33 % | |
| R2 | 0.0002 | 14.23 % | ||
| R1 | 0.0002 | 2.43 % | ||
| Current price: | 0.0002 | |||
| Support | S1 | 0.0001 | -35.77 % | |
| S2 | 0.0001 | -47.57 % | ||
| S3 | 0.00006667 | -66.67 % |
Accumulated Volume Support & Resistance Levels
| Level | Price | |||
|---|---|---|---|---|
| Resistance | R3 | 0 | . | |
| R2 | 0 | . | ||
| R1 | 0 | . | ||
| Current price | 0.0002 | |||
| Support | S1 | 0 | . | |
| S2 | 0 | . | ||
| S3 | 0 | . |
FAQ
Click here for our free guide on how to buy Ultrack Systems Stock.