Neutra Corp Stock Forecast
Neutra Corp stock price ended at $0.0003 on Wednesday, after losing 0%.
(Updated on Apr 24, 2024)
No changes to the price of Neutra Corp stock on the last trading day (Wednesday, 24th Apr 2024). During the last trading day the stock fluctuated 0% from a day low at $0.0003 to a day high of $0.0003. The price has been going up and down for this period, and there has been a 20% gain for the last 2 weeks.
The stock lies in the middle of a very wide and weak rising trend in the short term and a further rise within the trend is signaled. Given the current short-term trend, the stock is expected to rise 3.15% during the next 3 months and, with a 90% probability hold a price between $0.0002 and $0.0004 at the end of this 3-month period.
Ready to grow your portfolio? Here's your beginner's guide to opening a free brokerage account.
NTRR Signals & Forecast
A buy signal was issued from a pivot bottom point on Monday, April 22, 2024, and so far it has fallen 0%. Further rise is indicated until a new top pivot has been found. Furthermore, there is a buy signal from the 3 month Moving Average Convergence Divergence (MACD). Volume gained on the last day while the price remained unchanged. This is not a classical divergence, but the stock should be watched more closely at it may be a "turning point". The very low volume increases the risk and reduces the other technical signals issued. Some negative signals were issued as well, and these may have some influence on the near short-term development. The Neutra Corp stock holds sell signals from both short and long-term Moving Averages giving a more negative forecast for the stock. On corrections up, there will be some resistance from the lines at $0.0003 and $0.0003. A break-up above any of these levels will issue buy signals.
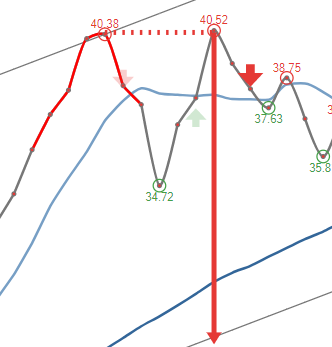 A sell signal from a double top formation was found on Friday, April 19, 2024 and based on theory for this formation the price should fall by -33.33% to $0.0002 within 2 trading days since signal was issued (Thursday, April 25, 2024).
Support, Risk & Stop-loss for Neutra Corp stock
On the downside, the stock finds support just below today's level from accumulated volume at $0.0003 and $0.0003. With no support from accumulated volume below today's level the risk is increased, as a drop below the support at $0.0003 may give a huge drop in the stock price.
This stock may move very much during the day (volatility) and with a very large prediction interval from the Bollinger Band this stock is considered to be "very high risk". During the last day, the stock moved $0 between high and low, or 0%. For the last week, the stock has had daily average volatility of 16.67%.
Our recommended stop-loss: We hold a negative evaluation for this stock. No stop-loss is set.
Trading Expectations (NTRR) For The Upcoming Trading Day Of Thursday 25th
For the upcoming trading day on Thursday, 25th we expect Neutra Corp to open at $0.0003, and during the day (based on 14 day Average True Range), to move between $0.0002 and $0.0004, which gives a possible trading interval of +/-$0.00007611 (+/-25.37%) up or down from last closing price. If Neutra Corp takes out the full calculated possible swing range there will be an estimated 50.74% move between the lowest and the highest trading price during the day.
Since the stock is closer to the support from accumulated volume at $0.0003 (13.33%) than the resistance at $0.0003 (13.33%), our systems sees the trading risk/reward intra-day as attractive and believe profit can be made before the stock reaches first resistance..
Is Neutra Corp stock A Buy?
Neutra Corp holds several negative signals and we believe that it will still perform weakly in the next couple of days or weeks. We, therefore, hold a negative evaluation of this stock.
Current score: -2.680 Sell Candidate Unchanged
Predicted Opening Price for Neutra Corp of Thursday, April 25, 2024
| Fair opening price April 25, 2024 | Current price |
|---|---|
| $0.0003 ( 0%) | $0.0003 |
The predicted opening price is based on yesterday's movements between high, low, and closing price.
Trading levels for NTRR
Fibonacci Support & Resistance Levels
| Level | Price | |||
|---|---|---|---|---|
| Resistance | R3 | 0.0003 | . | |
| R2 | 0.0003 | . | ||
| R1 | 0.0003 | . | ||
| Current price: | 0.0003 | |||
| Support | S1 | 0.0003 | . | |
| S2 | 0.0003 | . | ||
| S3 | 0.0003 | . |
Accumulated Volume Support & Resistance Levels
| Level | Price | |||
|---|---|---|---|---|
| Resistance | R3 | 0 | . | |
| R2 | 0.0004 | 16.67 % | ||
| R1 | 0.0003 | 13.33 % | ||
| Current price | 0.0003 | |||
| Support | S1 | 0.0003 | -13.33% | |
| S2 | 0.0003 | -16.67% | ||
| S3 | 0 | . |
FAQ
Click here for our free guide on how to buy Neutra Corp Stock.