PROSHARES ULTRA SMALLCAP600 PROSHARES Stock Forecast
Explanation to Bollinger's Bands
Bollinger Bands was created by John Bollinger in the early 1980s, its purpose is to define price action relative to the assets highs and lows. This technical indicator is used to identify buy and sell signals and has proven very well in doing so.
Bollinger Bands consist of a set of three curves drawn in relation to securities prices. The middle band is a measure of the intermediate-term trend, usually a simple moving average, that serves as the base for the upper and lower bands. The interval between the upper and lower bands and the middle band is determined by volatility, typically the standard deviation of the same data that were used for the average. StockInvest.us uses Bollingers suggested 20 day average.
Middle Bollinger Band = 20-period simple moving average
Upper Bollinger Band = Middle Bollinger Band + 2 * 20-period standard deviation
Lower Bollinger Band = Middle Bollinger Band - 2 * 20-period standard deviation
BandWidth defines the current width of the band.
%b defines the current position within the band.
BandWidth = (Upper Bollinger Band - Lower Bollinger Band) / Middle Bollinger Band
%b = (Last - Lower Bollinger Band) / (Upper Bollinger Band - Lower Bollinger Band)
Live Samples:
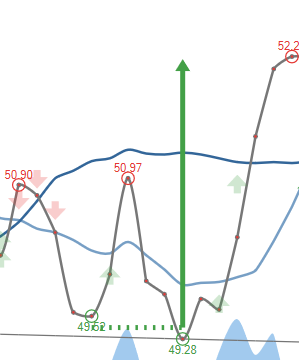
Bottlenecks in bandwidth indicate an upcoming change. Break up through the moving average line or continuous movements above the moving average line indicate a break up, and vice versa.
Source: http://www.bollingerbands.com
Stronger technical forecast for PROSHARES ULTRA SMALLCAP600 PROSHARES stock price after Friday trading.
(Updated on Apr 12, 2024)
The PROSHARES ULTRA SMALLCAP600 PROSHARES stock price gained 3.67% on the last trading day (Friday, 12th Apr 2024), rising from £177.00 to £183.50. During the last trading day the stock fluctuated 5.71% from a day low at £175.00 to a day high of £185.00. The price has risen in 4 of the last 10 days and is up by 1.38% over the past 2 weeks. Volume has increased on the last day along with the price, which is a positive technical sign, and, in total, 7 million more shares were traded than the day before. In total, 7 million shares were bought and sold for approximately £1.34 billion.
The stock has broken the weak rising the short-term trend up and an even stronger rate of rising is indicated. For any reaction back there will now be support on the roof on the current trend broken at £183.46, a level that may pose a second chance to hit a runner. According to fan-theory £195.31 will be the next possible trend-top level and thereby pose a resistance level that may not be broken at the first attempt.
SAA.L Signals & Forecast
Mostly positive signals in the chart today. The PROSHARES ULTRA SMALLCAP600 PROSHARES stock holds buy signals from both short and long-term Moving Averages giving a positive forecast for the stock, but the stock has a general sell signal from the relation between the two signals where the long-term average is above the short-term average. On corrections down, there will be some support from the lines at £175.64 and £175.81. A breakdown below any of these levels will issue sell signals. A buy signal was issued from a pivot bottom point on Wednesday, April 03, 2024, and so far it has risen 7.31%. Further rise is indicated until a new top pivot has been found. Furthermore, there is a buy signal from the 3 month Moving Average Convergence Divergence (MACD). Volume is rising along with the price. This is considered to be a good technical signal.
 A buy signal from a double bottom formation was found on Tuesday, March 12, 2024 with a target of £179.37. Despite whether the objective of the signal formation has been reached the stock may continue to perform well.
Support, Risk & Stop-loss for PROSHARES ULTRA SMALLCAP600 PROSHARES stock
PROSHARES ULTRA SMALLCAP600 PROSHARES finds support from accumulated volume at £179.00 and this level may hold a buying opportunity as an upwards reaction can be expected when the support is being tested.
In general the stock tends to have very controlled movements and with good liquidity the risk is considered very low in this stock. During the last day, the stock moved £10.00 between high and low, or 5.71%. For the last week the stock has had daily average volatility of 3.61%.
Our recommended stop-loss: £176.20 (-3.98%) (This stock has low daily movements and this gives low risk. There is a buy signal from a pivot bottom found 7 days ago.)
Trading Expectations (SAA.L) For The Upcoming Trading Day Of Monday 15th
For the upcoming trading day on Monday, 15th we expect PROSHARES ULTRA SMALLCAP600 PROSHARES ULTRA SMALLCAP600 to open at £181.17, and during the day (based on 14 day Average True Range), to move between £178.71 and £188.29, which gives a possible trading interval of +/-£4.79 (+/-2.61%) up or down from last closing price. If PROSHARES ULTRA SMALLCAP600 PROSHARES ULTRA SMALLCAP600 takes out the full calculated possible swing range there will be an estimated 5.22% move between the lowest and the highest trading price during the day.
With no resistance above and support from accumulated volume @ £179.00, some £4.50 (2.45%) from the current price of £183.50, our system finds the risk reward attractive.
Earnings coming up
PROSHARES ULTRA SMALLCAP600 PROSHARES ULTRA SMALLCAP600 will release earnings BMO on Tuesday, April 16, 2024. We will update the financials statements for PROSHARES ULTRA SMALLCAP600 PROSHARES ULTRA SMALLCAP600, that can be found here as soon as the records are public. Our systems has calculated a possible swing of +/- 5.68% in the first trading day after earnings release.
Is PROSHARES ULTRA SMALLCAP600 PROSHARES ULTRA SMALLCAP600 stock A Buy?
Several short-term signals, along with a general good trend, are positive and the stock has broken the rising trend up, which indicates an even stronger rate of rising. We can conclude that the current level may hold a buying opportunity as there is a fair chance for PROSHARES ULTRA SMALLCAP600 PROSHARES stock to perform well in the short-term period. Due to a possible false trend-break listing stock as pure buy candidate is held back. We have upgraded our analysis conclusion for this stock since the last evaluation from a Sell to a Buy candidate.
Current score: 2.255 Buy Candidate Upgraded
Predicted Opening Price for PROSHARES ULTRA SMALLCAP600 PROSHARES ULTRA SMALLCAP600 of Monday, April 15, 2024
| Fair opening price April 15, 2024 | Current price |
|---|---|
| £181.17 ( 1.27%) | £183.50 |
The predicted opening price is based on yesterday's movements between high, low, and closing price.
Trading levels for SAA.L
Fibonacci Support & Resistance Levels
| Level | Price | |||
|---|---|---|---|---|
| Resistance | R3 | 191.17 | 4.18 % | |
| R2 | 187.35 | 2.10 % | ||
| R1 | 184.99 | 0.81 % | ||
| Current price: | 183.50 | |||
| Support | S1 | 177.35 | -3.35 % | |
| S2 | 174.99 | -4.64 % | ||
| S3 | 171.17 | -6.72 % |
Accumulated Volume Support & Resistance Levels
| Level | Price | |||
|---|---|---|---|---|
| Resistance | R3 | 0 | . | |
| R2 | 0 | . | ||
| R1 | 0 | . | ||
| Current price | 183.50 | |||
| Support | S1 | 179.00 | -2.45% | |
| S2 | 168.00 | -8.45% | ||
| S3 | 167.50 | -8.72% |
SAA Dividend Payout History
| # | Ex-Date | Pay Date | Amount | Yield | |
|---|---|---|---|---|---|
| 1 | May 09, 2024 | May 09, 2024 | Jun 24, 2024 | £1.60 | 0.87% |
| 2 | Jun 08, 2023 | Jun 08, 2023 | Jun 08, 2023 | £1.50 | 0.86% |
| 3 | Sep 24, 2019 | Oct 24, 2019 | Nov 08, 2019 | £2.45 | 1.42% |
| 4 | Mar 27, 2019 | Jun 06, 2019 | Jul 05, 2019 | £8.51 | 2.45% |
| 5 | Mar 27, 2019 | Jun 05, 2019 | Jul 05, 2019 | £8.51 | 2.45% |
FAQ
Click here for our free guide on how to buy PROSHARES ULTRA SMALLCAP600 PROSHARES ULTRA SMALLCAP600 Stock.