Nuveen Multi Market Income Fund Inc Stock Forecast
Nuveen Multi Market Income Fund Inc stock downgraded to Hold/Accumulate
(Updated on Apr 18, 2024)
The Nuveen Multi Market Income Fund Inc stock price gained 0.326% on the last trading day (Thursday, 18th Apr 2024), rising from $5.82 to $5.84. During the last trading day the stock fluctuated 0.498% from a day low at $5.82 to a day high of $5.85. The price has fallen in 7 of the last 10 days and is down by -3.39% for this period. Volume fell on the last day by -4 thousand shares and in total, 2 thousand shares were bought and sold for approximately $9.32 thousand. You should take into consideration that falling volume on higher prices causes divergence and may be an early warning about possible changes over the next couple of days.
The stock is at the lower part of a narrow and horizontal trend in the short term, and normally this may pose a good buying opportunity, though a breakdown through the bottom trend line at $5.81 will give a strong sell signal and a trend shift may be expected. Given the current horizontal trend, you can expect Nuveen Multi Market Income Fund Inc stock with a 90% probability to be traded between $5.80 and $6.08 at the end of this 3-month period. A break of a horizontal trend is often followed by a large increase in the volume, and stocks seldom manage to go directly from the bottom of a trend up to the top. Stocks turning up in the middle of a horizontal trend are therefore considered to be potential runners.
Ready to grow your portfolio? Here's your beginner's guide to opening a free brokerage account.
JMM Signals & Forecast
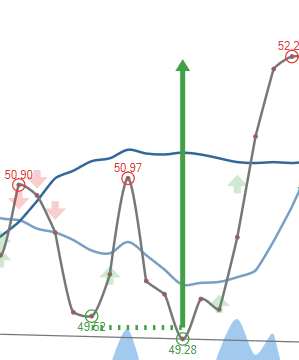
A buy signal was issued from a pivot bottom point on Tuesday, April 16, 2024, and so far it has risen 0.344%. Further rise is indicated until a new top pivot has been found. Some negative signals were issued as well, and these may have some influence on the near short-term development. The Nuveen Multi Market Income Fund Inc stock holds sell signals from both short and long-term Moving Averages giving a more negative forecast for the stock. Also, there is a general sell signal from the relation between the two signals where the long-term average is above the short-term average. On corrections up, there will be some resistance from the lines at $5.88 and $6.00. A break-up above any of these levels will issue buy signals. Furthermore, there is currently a sell signal from the 3 month Moving Average Convergence Divergence (MACD). Volume fell during the last trading day while the price increased. This causes a divergence and may be considered as an early warning, but it may not be. The very low volume increases the risk and reduces the other technical signals issued. The stock had a Golden Star Signal on Thursday, July 27, 2023 in the long-term chart.
Golden Star Signal is when the short-term moving average, the long-term moving average, and price line meet in a special combination. This combination is very rare and often followed by long and strong gains for the stock in question.
Golden Star 12 Months
The stock had a Golden Star Signal on Thursday, July 27, 2023 in the long-term chart.Golden Star Signal is when the short-term moving average, the long-term moving average, and price line meet in a special combination. This combination is very rare and often followed by long and strong gains for the stock in question.
 A buy signal from a double bottom formation was found on Tuesday, April 16, 2024 and based on theory for this formation the price should go up by 6.58% to $6.22 within 36 trading days since signal was issued (Friday, April 19, 2024).
Support, Risk & Stop-loss for Nuveen Multi Market Income Fund Inc stock
Nuveen Multi Market Income Fund Inc finds support from accumulated volume at $5.82 and this level may hold a buying opportunity as an upwards reaction can be expected when the support is being tested.
In general the stock tends to have very controlled movements and therefore the general risk is considered very low. However, be aware of low or falling volume and make sure to keep an eye on the stock During the last day, the stock moved $0.0290 between high and low, or 0.498%. For the last week the stock has had daily average volatility of 0.87%
Nuveen Multi Market Income Fund Inc is oversold on RSI14 (8). Some stocks may fall long and hard while being oversold on RSI, but stocks that are heavily oversold on RSI often pose good re-bounce chance and played well it can be a buy candidate.
Our recommended stop-loss: $5.48 (-6.22%) (This stock has low daily movements and this gives low risk. Low RSI14 is 8 which reduces the risk some. There is a buy signal from a pivot bottom found 2 days ago.)
Trading Expectations (JMM) For The Upcoming Trading Day Of Friday 19th
For the upcoming trading day on Friday, 19th we expect Nuveen Multi Market Income Fund Inc to open at $5.84, and during the day (based on 14 day Average True Range), to move between $5.80 and $5.88, which gives a possible trading interval of +/-$0.0441 (+/-0.76%) up or down from last closing price. If Nuveen Multi Market Income Fund Inc takes out the full calculated possible swing range there will be an estimated 1.51% move between the lowest and the highest trading price during the day.
Since the stock is closer to the support from accumulated volume at $5.82 (0.33%) than the resistance at $5.87 (0.51%), our systems sees the trading risk/reward intra-day as attractive and believe profit can be made before the stock reaches first resistance..
Is Nuveen Multi Market Income Fund Inc stock A Buy?
Nuveen Multi Market Income Fund Inc holds several negative signals and this should be a sell candidate, but due to the general chance for a turnaround situation it should be considered as a hold candidate (hold or accumulate) in this position whilst awaiting further development. Due to some small weaknesses in the technical picture we have downgraded our analysis conclusion for this stock since the last evaluation from a Buy to a Hold/Accumulate candidate.
Current score: -0.184 Hold/Accumulate Downgraded
Predicted Opening Price for Nuveen Multi Market Income Fund Inc of Friday, April 19, 2024
| Fair opening price April 19, 2024 | Current price |
|---|---|
| $5.84 ( 0.0285%) | $5.84 |
The predicted opening price is based on yesterday's movements between high, low, and closing price.
Trading levels for JMM
Fibonacci Support & Resistance Levels
| Level | Price | |||
|---|---|---|---|---|
| Resistance | R3 | 5.87 | 0.468 % | |
| R2 | 5.86 | 0.278 % | ||
| R1 | 5.85 | 0.161 % | ||
| Current price: | 5.84 | |||
| Support | S1 | 5.83 | -0.218 % | |
| S2 | 5.82 | -0.335 % | ||
| S3 | 5.81 | -0.525 % |
Accumulated Volume Support & Resistance Levels
| Level | Price | |||
|---|---|---|---|---|
| Resistance | R3 | 6.04 | 3.42 % | |
| R2 | 5.96 | 2.05 % | ||
| R1 | 5.87 | 0.514 % | ||
| Current price | 5.84 | |||
| Support | S1 | 5.82 | -0.325% | |
| S2 | 5.82 | -0.342% | ||
| S3 | 0 | . |
JMM Dividend Payout History
| # | Ex-Date | Pay Date | Amount | Yield | |
|---|---|---|---|---|---|
| 1 | Apr 01, 2024 | Apr 12, 2024 | May 01, 2024 | $0.0275 | 0.468% |
| 2 | Mar 01, 2024 | Mar 14, 2024 | Apr 01, 2024 | $0.0275 | 0.452% |
| 3 | Feb 01, 2024 | Feb 14, 2024 | Mar 01, 2024 | $0.0275 | 0.459% |
| 4 | Jan 02, 2024 | Jan 11, 2024 | Feb 01, 2024 | $0.0275 | 0.451% |
| 5 | Dec 01, 2023 | Dec 14, 2023 | Dec 29, 2023 | $0.0275 | 0.465% |
FAQ
Click here for our free guide on how to buy Nuveen Multi Market Income Fund Inc Stock.