
If you ever wanted a signal to help you perform better, the Relative Strength Index (RSI) will be your best friend.
J. Welles Wilder originally developed the indicator. He presented it for the first time in 1978 in his book "New Concepts in Technical Trading Systems." However, when is a stock oversold or overbought? To solve this question, J. Welles Wilder, a machine engineer, turned to mathematics and created the RSI formula, which gives a score between 0-100. He later assigned values under 30 as "oversold" and above 70 as "overbought."
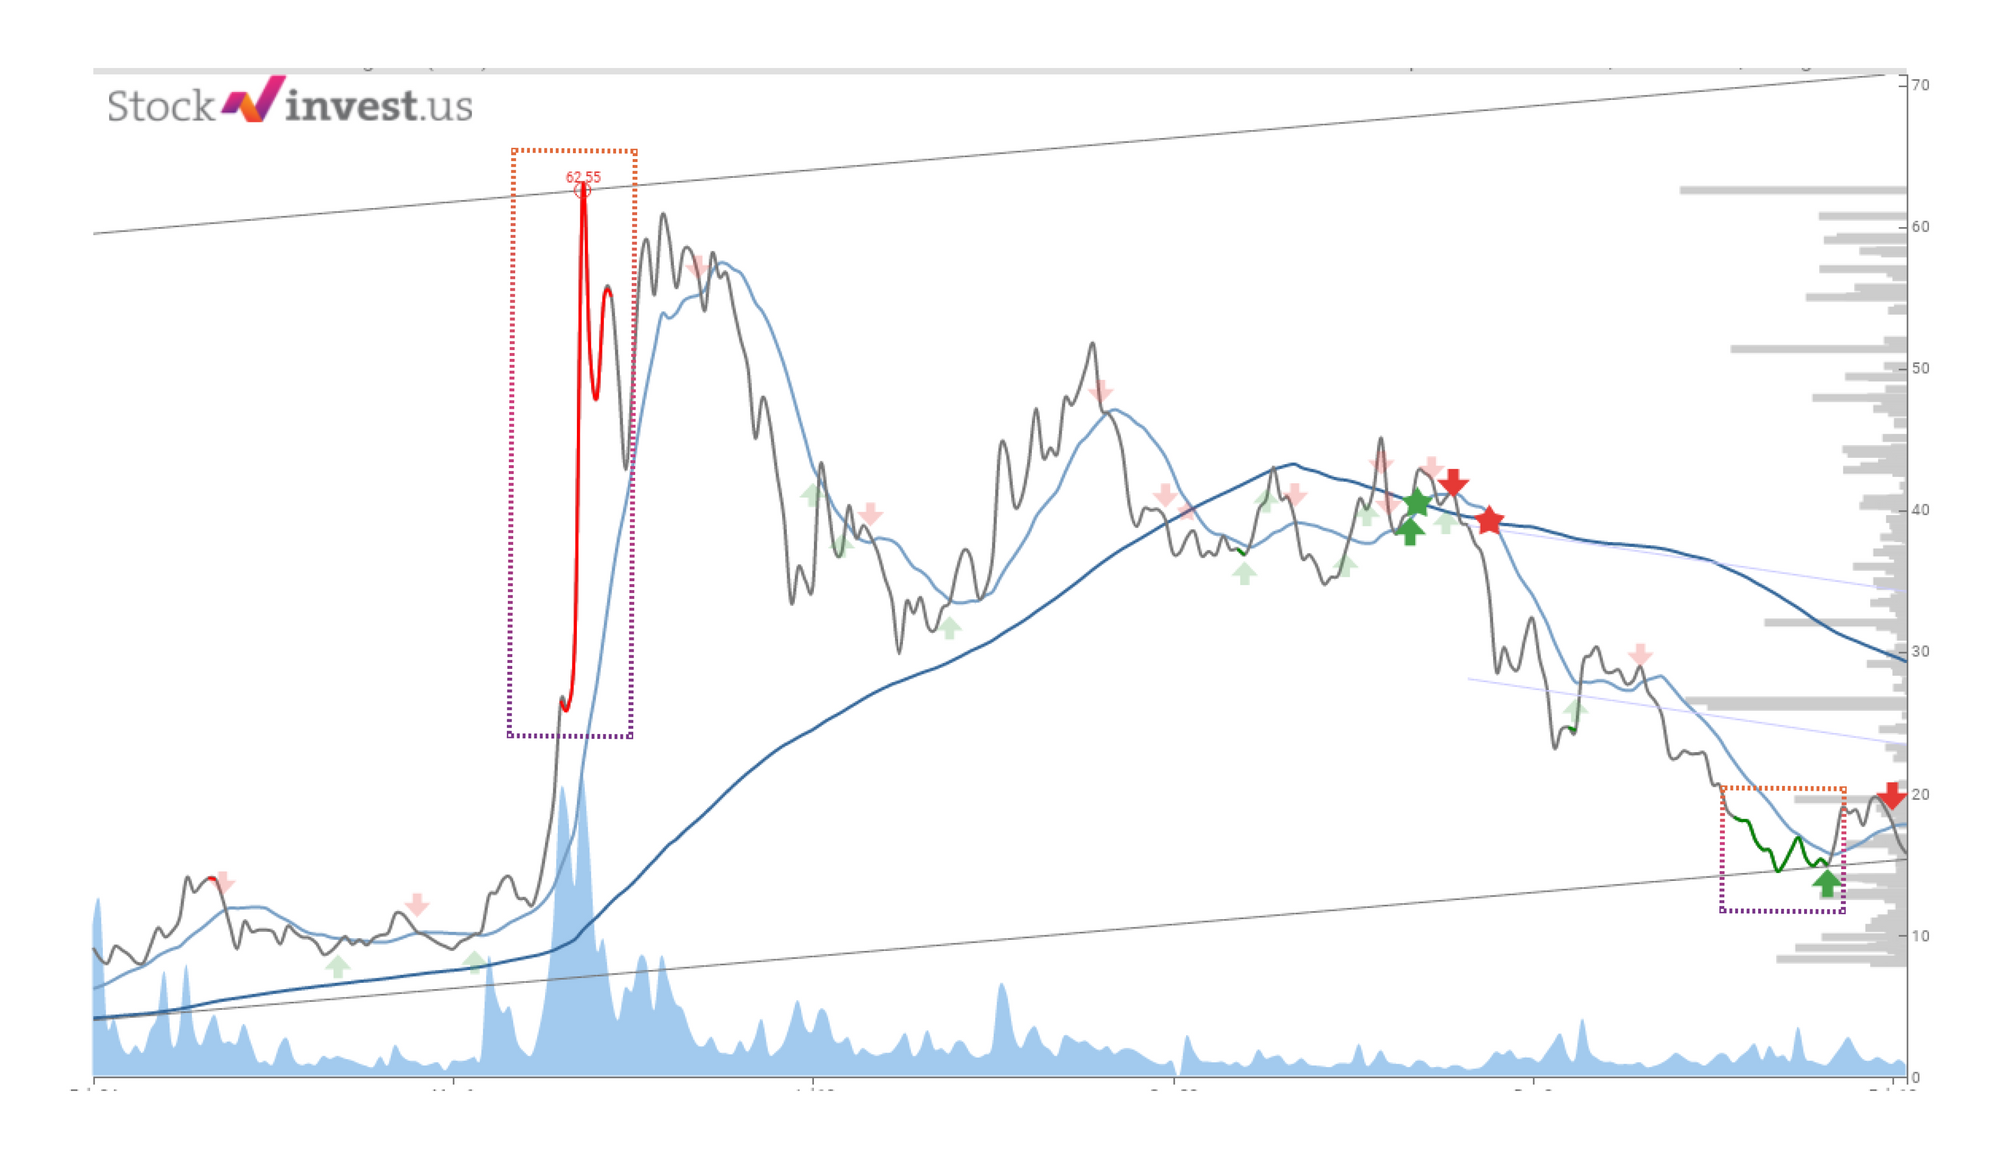
This is normally marked as red for the price line of overbought and green for the price line of oversold.
Now you probably think that you found the secret formula for profitable trading. It is not that obvious, and again you will lose money if you jump to the idea. To prevent that, you need to understand a few catches before taking full advantage of the RSI tool.
It makes sense that people are less negative in an upturn market. The sentiment is positive, and beliefs are strong. Everything is possible if you are in a good mood, and this is usually reflected in the stock market. Often, stocks and even the whole market itself can go long and hard in overbought (RSI higher than 70). So what conclusion can be made from this?
Well… Overbought is not simply overbought. You will be better off if you say that overbought is when the assigned value is higher than 80 with an upward trend, and oversold is when the assigned value is less than 40. It is the total opposite in a negative trend. Then RSI above 70 is "oversold." The reason for this is very logical and straightforward. If a stock is already in a falling trend, negativism has a general weight, and it takes less to trigger further fall. And if you are feeling negative first, well, then it takes a long time for you to be positive, so stocks in a falling trend can stay oversold longer than normal.
To make it even worse. There is a huge individual difference from stock to stock. General volatile stocks (like penny stocks) statistically stay oversold and overbought longer than, e.g., solid stocks like Apple.
Again it all comes down to strategy, and you need to define it yourself. If trading by RSI is in your strategy, it should be clearly defined like:"I will buy stocks in an upwards trend and use oversold RSI as an entry point."
Now, you will need to scan the market for all stocks in a rising trend with a low RSI. You can always use our tools to make that. We create a list of candidates matching such requests. However, still, half of the job is done. It would be best if you considered the individual patterns for each stock. The best way to do this is just by looking at the chart. How did the stock behave in the past when being oversold? Does it usually react quickly, or can it be oversold for an extended period? What is the most common reaction? Just 2-4% reaction up or 20%? There is no point in being a day trader buying a stock on oversold RSI if it usually uses a very long time to gain even 5%. RSI is generally better as a long-term signal than a short-term indicator.
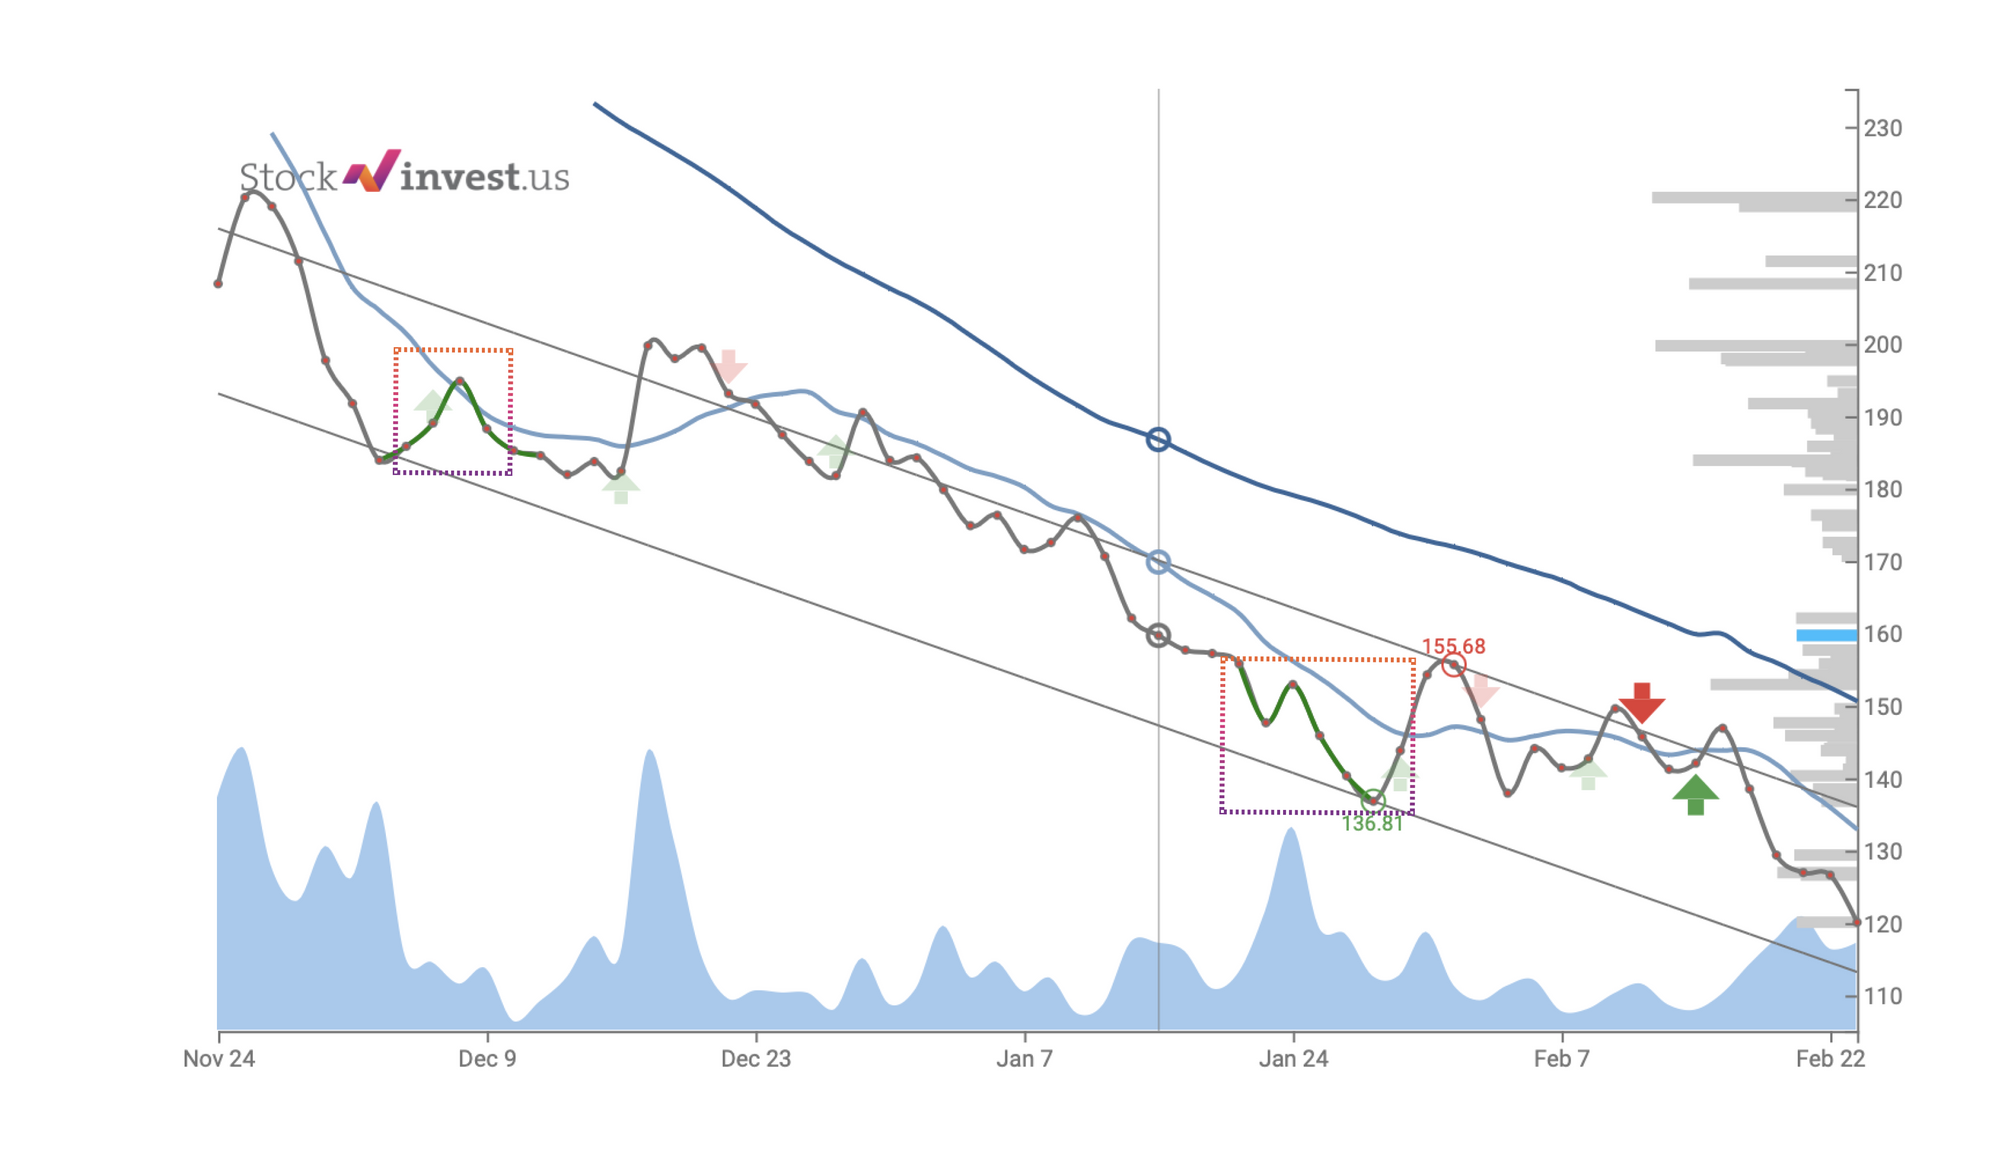
In the sample above, ZM was oversold on late January 2022. The same situation happened on the beginning of December 2021. The stock gained from $183.92 to $194.86. It has already taken out about the same gain and falling trend. This is still no "buy case." Analyzing history in your trading is essential, but you should be aware that patterns change, so always consider this. It may very well be that ZM now will gain 40%, but statistically, the chances are higher that it will continue to fall. Where do you put your gamble? Why not go for a safer bet?
So what is the lesson about RSI?
- RSI can be measured in a different time frame. The most common is 14 and 21, whereas 14 is short term and 21 long terms;
- RSI is, in general, more predictable as a long-term signal;
- The RSI effect depends on the trend direction;
- The RSI effect differs from stock to stock. Volatility matters.