As an investor, you always seek to understand what other traders think and how they will act. The Moving Average is one of the best technical indicators to answer this question. Moving Average is one of the most common trading methods and the basic indicator in most automatic trading platforms. One of the significant advantages of Moving Average is how easy it is to understand and use.
This makes it easy to include into any trading strategy you may have, as it simply is: buy if the Moving Average is under the price line, and sell if it goes above.
However, despite being easy to use and understand, you need to know a few things if you want to utilize the full potential of Moving Average.
If you use it blindly, you will find yourself popping in and out of shares without making much money. In the worst case, your popping in and out will make you lose even more. If it is that easy to make money on Moving Average, why doesn't everyone use it and become billionaires? The answer is always the same; it probably is if something sounds too good to be true. Only a few traders master the trading with Moving Averages, but most traders should be able to cut their losses substantially just by knowing a little about this indicator.
Moving average - the intent.
The first description of Moving Average is honored by R.H. Hooker (1901) and published as "instantaneous averages" in the Journal of the Royal Statistical Society by G.U Yule in 1909 (Journal of the Royal Statistical Society, 72, 721-730) and in book form by W.I King in 1912 (Elements of Statistical Method). But the fact is that Moving Average has been used for decades.
Moving Average belong to the grouping Time Series Analysis and can be applied to anything that holds a defined (time) series data. Technically, Moving Average is a way of smoothing out the price based on history.
This is because we seek a way to predict the future and use history to do so. By smoothing the price, we reduce noise. You may consider noise a distraction, like news that substantially impacts the stock when released.
More than one person has lost his/her money while jumping on an intraday rocket to slam to the ground the following day because the news has no real impact on the share value. In fact, un-serious brokers, companies, and traders may often use "news" as part of their pump and dump tactic or damage control. No one is better than Tesla CEO - Elon Musk. He pushed comments and news just before bad quarterly results and was fined $20 million (in late 2018) for news made up, while high on a joint, about south Arabic investors offering premium prices. And his joint stunt did the work it was supposed to do...
We want to reduce noise based on the same principle and psychological factor as we turn the head if a police car drives by with sirens on. Noise attracts our attention, and we lose focus. Moving Averages can be considered as dynamic trends trying to say something about the general direction. Noise is smoothed out, and the length of the smoothing defines if it is a short-term or long-term signal. If the price is under the Moving Average, there is a general SELL signal and a BUY signal when above. It is common to use the abbreviation MV for Moving Average, where the following number describes the days of smoothing (e.g., MV35 means moving Average smoothed over 35 days).
Moving Average - the understanding.
When we apply the Moving Average in the trading, we buy shares if the price goes above the moving Average and sell if it goes below. Here we see the price as an indicator of behavior. Price going up or down indicates the level of investor optimism. Still, we want to reduce the noise, like news, and erratic behavior, to get a correct view of the general direction of the stock and what the most current action indicates. We make a benchmark (Moving Average) and use this as a baseline. If the price is going up above the Moving Average, this indicates that the investors are getting more positive, and this will likely push the price higher in the short term. If the price goes below the Moving Average, it indicates a negative change. Moving Average crossing the price line can be considered as a switch or early warning, and it is this knowledge you trade on.
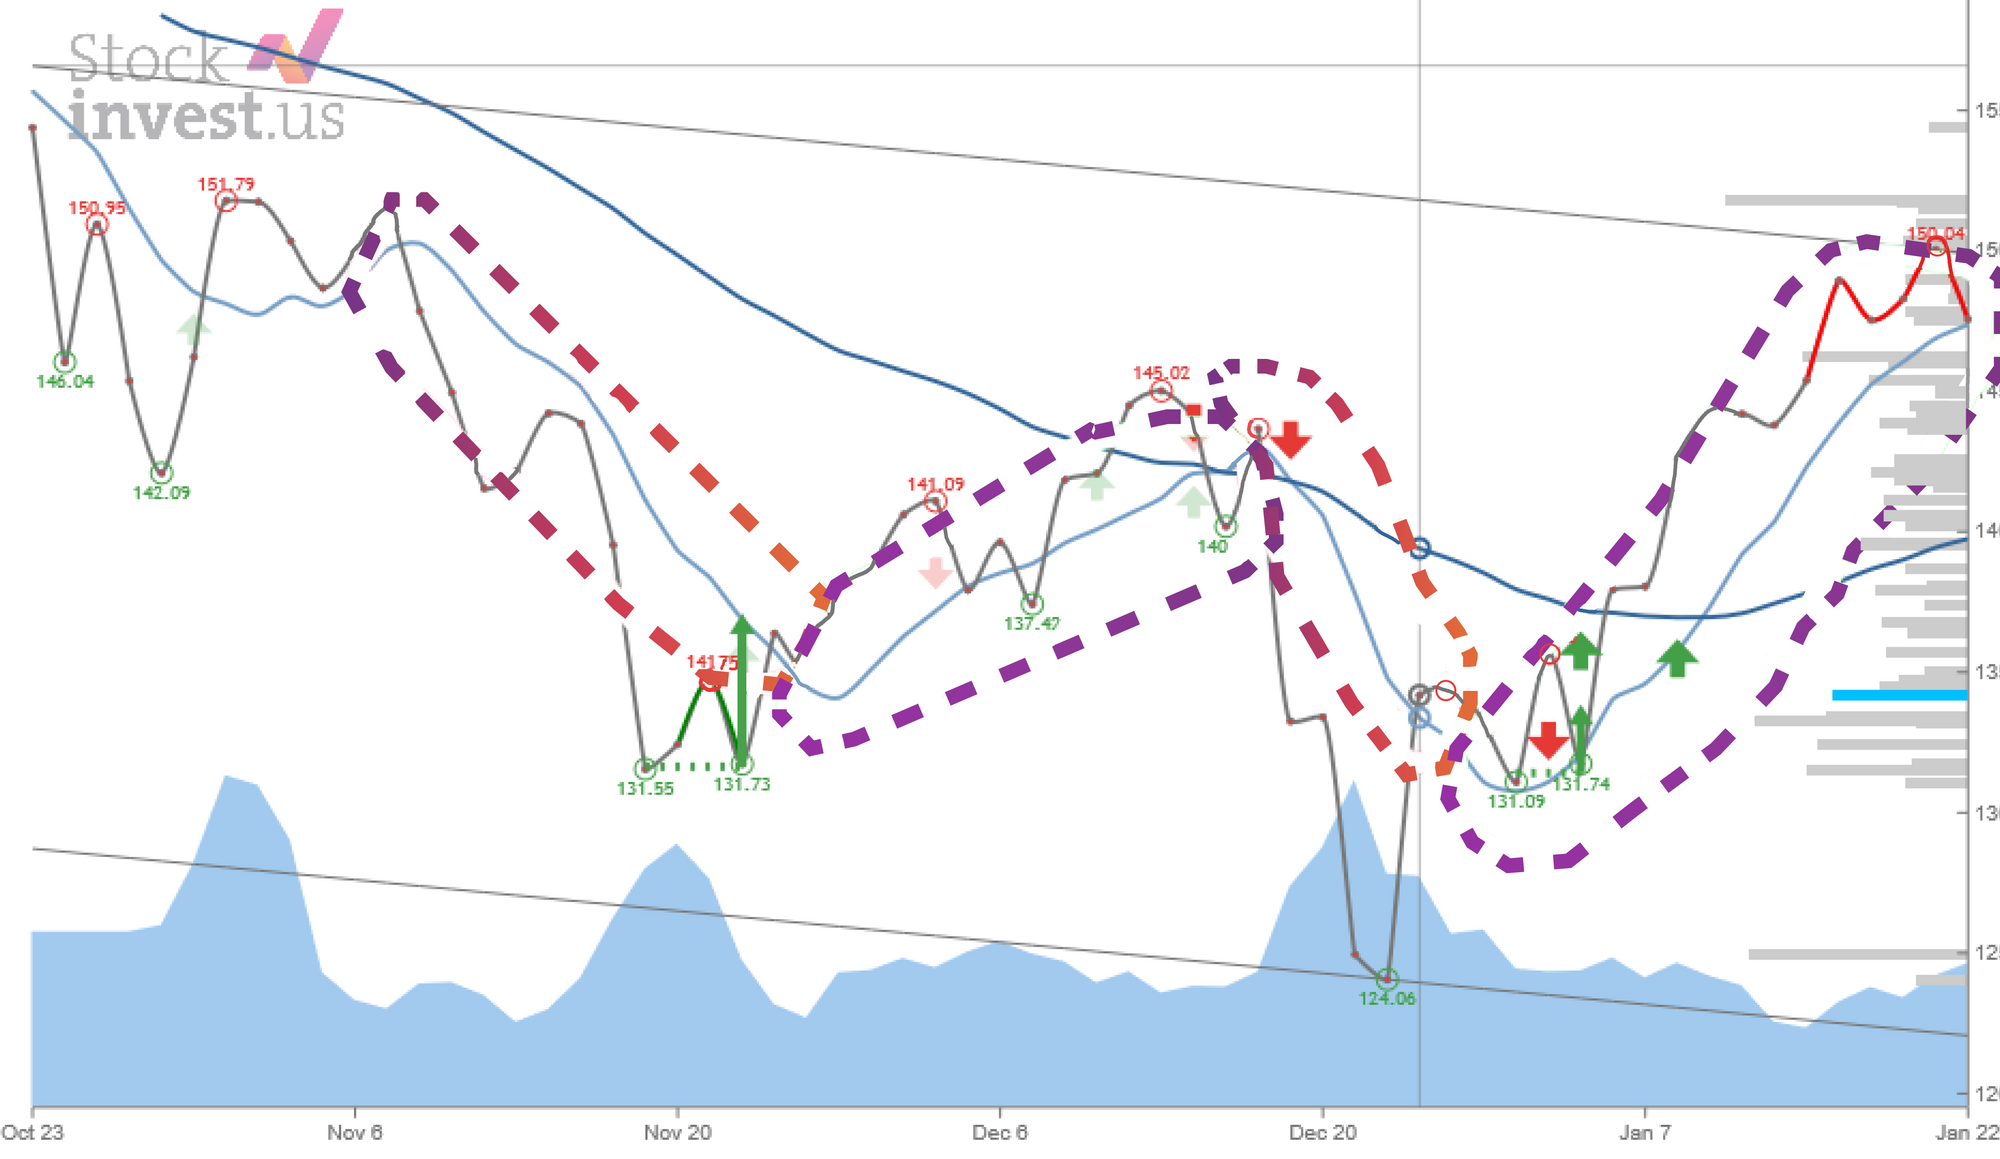
You will quickly learn that the Moving Average is very reliable for some stocks and not for others. It even depends on the current market situation, and you will have to decide what time (smoothing) factor should be used. For some stocks, you will need longer or shorter smoothing periods depending on the stock volatility, which will be highly reflected in your trading horizon. As a thumb rule, you will use longer smoothing for the longer trading horizon you have. Furthermore, using the Moving Average as a BUY strategy on stocks in a falling trend is close to hopeless unless there is enough volatility, as in the F.B. chart above. The stock is in a generally weak falling trend but is moving so much up and down (volatility) that there are obvious trading opportunities. To avoid digging too deep into it, we can assign three important elements to the Moving Average strategy:
- VOLATILITY - How volatile is the stock you are trading?
- TIME - What time length is used when calculating the Moving Average?
- LIQUIDITY - How reliable is the MV?
Since MV is just an average, it also becomes clear that eventually, it will get back to the price line. If the stock is traded every day for $5 the Moving Average will become $5. A BUY from Moving Average (price above the MV line) is not an indefinite situation. From a trading perspective, you - to optimize the signal's outcome - need to get out of the BUY or SELL position before the Moving Average goes back to the price line and flips to the opposite signal. But let us start with VOLATILITY and the first rule:
Volatility will affect the use of the Moving Average as a trading tool.
Volatility can be seen as a risk and is visualized by how much the stock turns up or down. If the stock fluctuates much during a trading day, the stock has high intraday volatility. This can be measured by looking at the price high and price low during a day. Many stocks out there have intraday fluctuations above 5% but still low daily volatility. These are perfect trading stocks for intraday traders, and they will use Moving Average on intraday data. Another measure is daily volatility, weekly, monthly, and even yearly. As I have mentioned several times, volatility equals risk. When trading with penny stocks, using Moving Average is almost a guaranteed way to lose your money. At the same time, you need some volatility to trade efficiently using MV. This is where Liquidity comes to our aid: good general Liquidity usually equals less risk. And by that, I do not mean good Liquidity for a day or two but merely refer to the size of the stock/company.
The second rule is:
Liquidity (volume * price) will tell you information about the risk. The higher the Liquidity, the more reliable the Moving Average is.
Time is extremely important because this is where money is made and lost. Time is relative, and you need to think about time as a concept. To this concept, you will add the proper Moving Average that fits your trading strategy, the stock(s) in question, and the stock's volatility(s).
Time as a concept is the result of 2 factors: your trading horizon and the behavior of the price. For example, if you are a short-term trader, using MV100 is not your interest. And if the stock is just steadily going in one direction (behavior), you will have to use a longer Moving Average than you usually would.
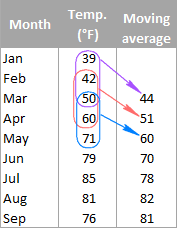
You can see how a simple MV is calculated in the picture above. In this example, three executive days are added together and divided by 3. The abbreviation would be MV3. For the common stock trader, the most used MV's are M7, MV35, MV100, and MV200.
Some formulas are made to calculate the best Moving Average to use, and the introduction of machine learning (ML) will help optimize tremendously. Most charting programs offer ways to select a Moving Average or use the best Average based on statistics. There is nothing wrong with using several MV at the same time, and if you keep a nice spread, they will give initial signals you can play with. We will speak about it later. The MV of 100 and 200 are most widely used for long-term trading.
Some keynotes:
- Do not use the moving Average as a BUY signal if the stock is within a falling trend. Play some bingo instead. In falling trends, use a Moving Average for shorting;
- If fundamental news has been dropped, do not use MV as a BUY signal, as this will disturb the Moving Average unless you smooth it long enough;
- Playing the MV strategy without understanding that you have to beat a zero-sum game is like taking the zip line without a safety belt.
Moving Average - digging into the nuances.
For the more advanced trader, there are more secrets to be revealed. One is the many different ways of calculating MV. So what should you use? Simple Moving Average (SMA) or weighted Moving Average (WMA)? Perhaps a more complex method?
Using Moving Average is working with statistics, and please do remember that all statistics pointed Hillary Clinton to winning, while Donald Trump did win. The same is with the Moving Average. It may indicate something, but the outcome is different. A lot of this has to do with not taking into account variables and being biased. We already discussed variables like time length, volatility, etc. To avoid bias, you should find a method to select what kind of MV you should use and the rules for the smoothing length. This does not have to be advanced. It can be based on, e.g., Liquidity and as simple as "for stocks with Average Liquidity less than 1 million per day I will use MV35" or "for stocks with more than 5% daily Volatility I will use a weighted Moving Average".
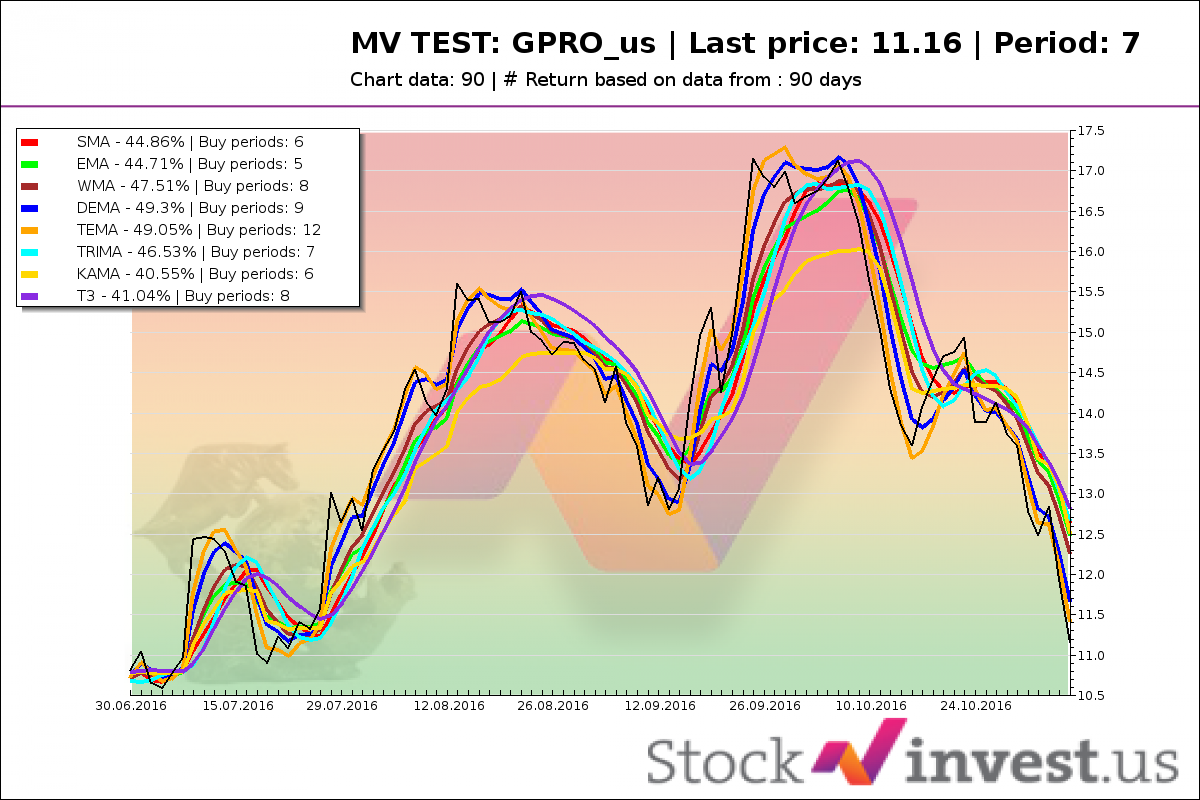
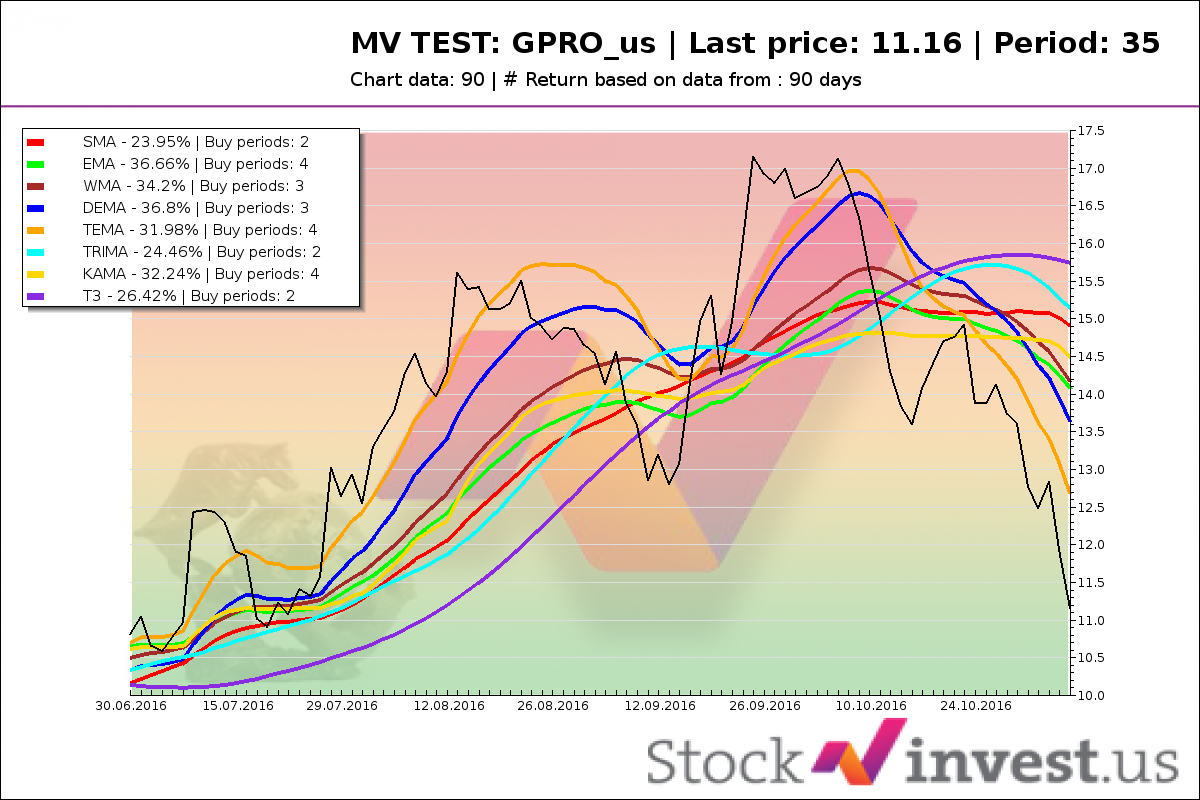
Below are two images for different Moving Averages in 3 months for GoPro. (GPRO)
In those images, you can see eight different ways of calculating MV and the returns that are given from each method. In the first example, we use MV7 (Moving Average for seven days), and in the other MV35. By first eyesight, it looks like you should always use MV7 (40%+ vs. 30%+). However, never underestimate the difference in risk when you have to do 9 trades instead of 2.
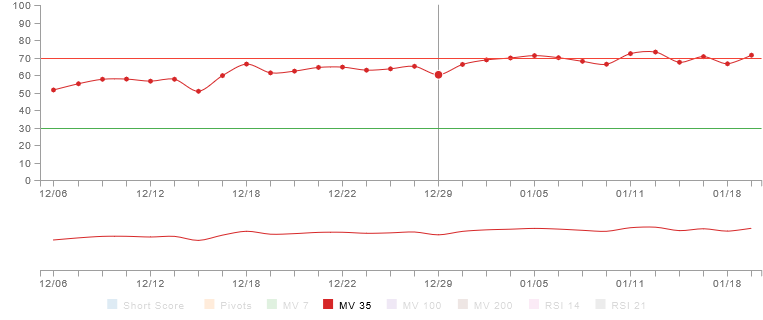
Below is a picture showing other ways of using moving averages. In this specific case, from our hausse indexes, we use buy signals issued from MV35 to measure the market situation. The chart shows the results of the MV35 signal from more than 7 000 shares and shown in percent. As the image shows, the investors are getting more and more positive. At some point, you reach a level where too many investors are optimistic, and Liquidity is limited. In other words, at some point, you run out of money, and the next option is to sell.
Moving average - The Death Cross.
Suppose we define Moving Average as the investor's level of optimism and divide this into short-term, medium-term, and long-term investors. In that case, we get the option of looking at the differences between them. This relationship between short and long-term Moving Averages gave birth to the notorious Death Cross that has appeared in all major stock market setbacks, starting with the major crash of 1929.
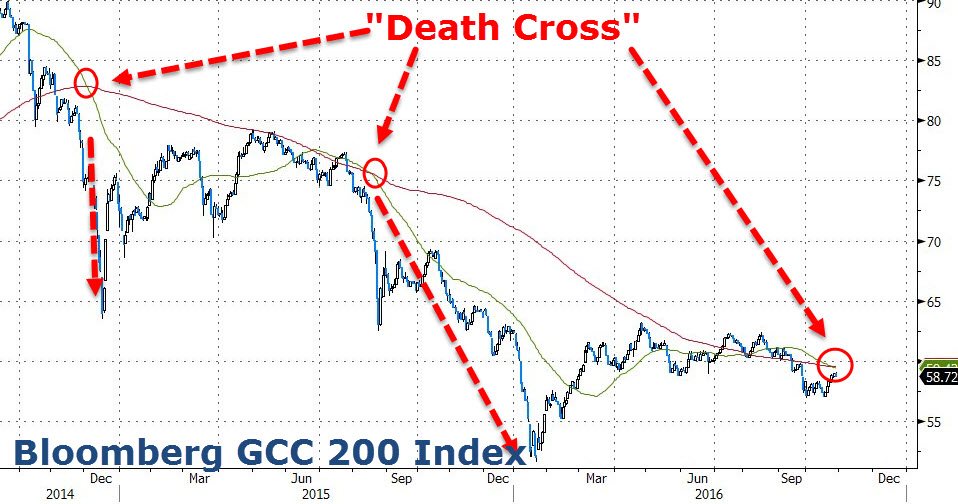
The death cross appears when a short-term Moving Average passes down under the long-term Moving Average. It is an established truth that the death cross should be based on MV50 (short) and MV200 (long), but this is a truth with large modifications.
Furthermore, as Jeff Cox in CNBC points out in the article: "Looks like the Golden Cross isn't so golden after all." Golden Cross is the opposite of the Death Cross, and as Jeff Cox points out when measuring all established crosses from 1969 to 2012, there is proof that the signal has any real value. So how come it seems to be a perfect signal sometimes, but not all times? The answer is the same as why people keep losing money on stock trading; you blindly follow an idea. And as I pointed out in the previous section, you will need to adjust and adapt. Who said 50/200 is the correct way to measure 50 years? There might be a long sideways period and lack of volatility, making signals flip in and out, but this does not make the signal less valuable. Moving Averages are excellent signals if used correctly.
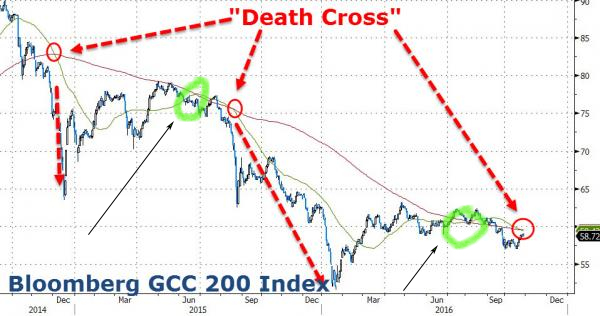
If we look at the image above, which represents a Golden Cross (the opposite of the Death Cross), it is obvious that the signal's return is poor, even creating a loss. As stated earlier, you should not use MV as a BUY signal in falling trends unless there is enough volatility. It can indicate that you are on the alert and use other signals to verify possible changes.
Moving average - The Golden Star.
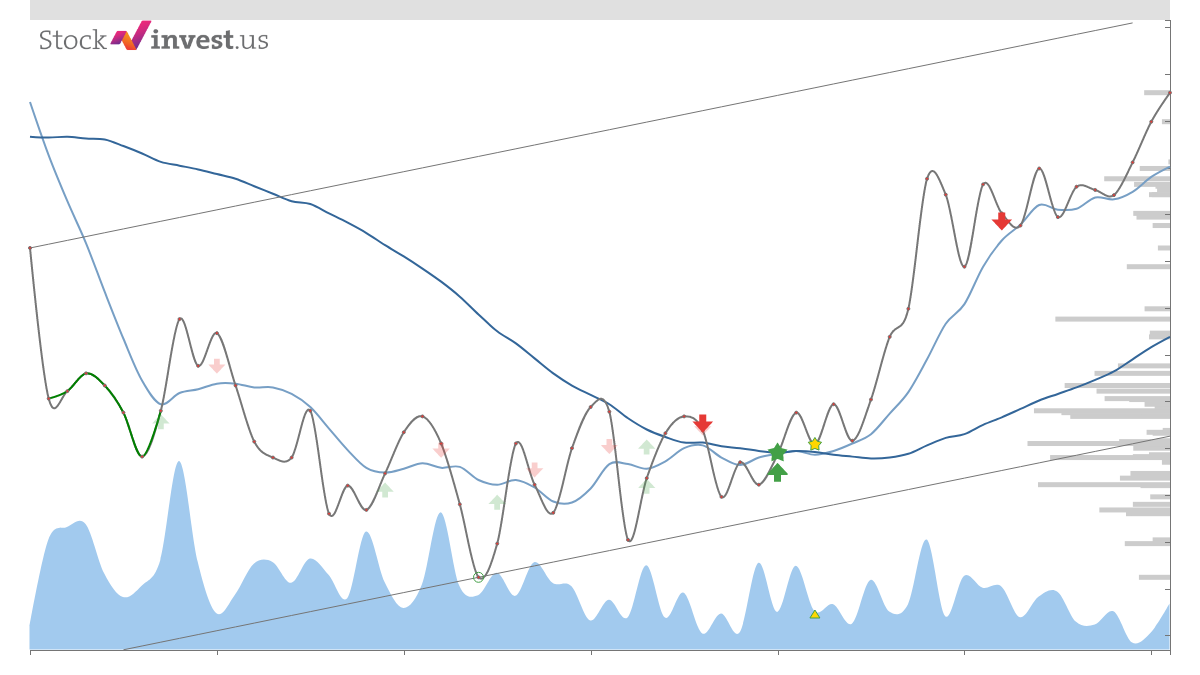
I have always been a fan of the Moving Averages as it is truly helpful when timing entering and exiting points in-stock positions. I always wanted to optimize the use of the signal, either by finding ways to set proper moving averages based on the individuality of the stock or by narrowing it to use statistics (backtesting). In 2005 I came up with the idea to strengthen the Golden Cross signal by adding a condition to it. After a lot of backtesting and actual trading, I ended up with my version of the Golden Cross - "The Golden Star," which was first released on Getagraph.com. One of the conditions I added was the need for the Golden Cross to appear in the price line, as illustrated in the graph below.
This signal has turned to yield far better than the Golden Cross, and if you add other conditions like Liquidity, time, and volatility, you get a very tradeable signal. Today the signal is only accessible at StockInvest.us.
The Moving Average is an excellent tool to help you understand what other traders are thinking and how they will act. Using an MV as one of your technical indicators allows you to make better decisions about when to enter or exit the market. Check out our other articles for more information on using different technical signals in your trading strategy. Thanks for reading!