
Many new traders getting into technical analysis forget that Volume is not the same as Liquidity (when speaking about trading). Volume is the amount of shares traded, while Liquidity is the amount of money spent in trading. Liquidity is therefore defined as Volume * Price.
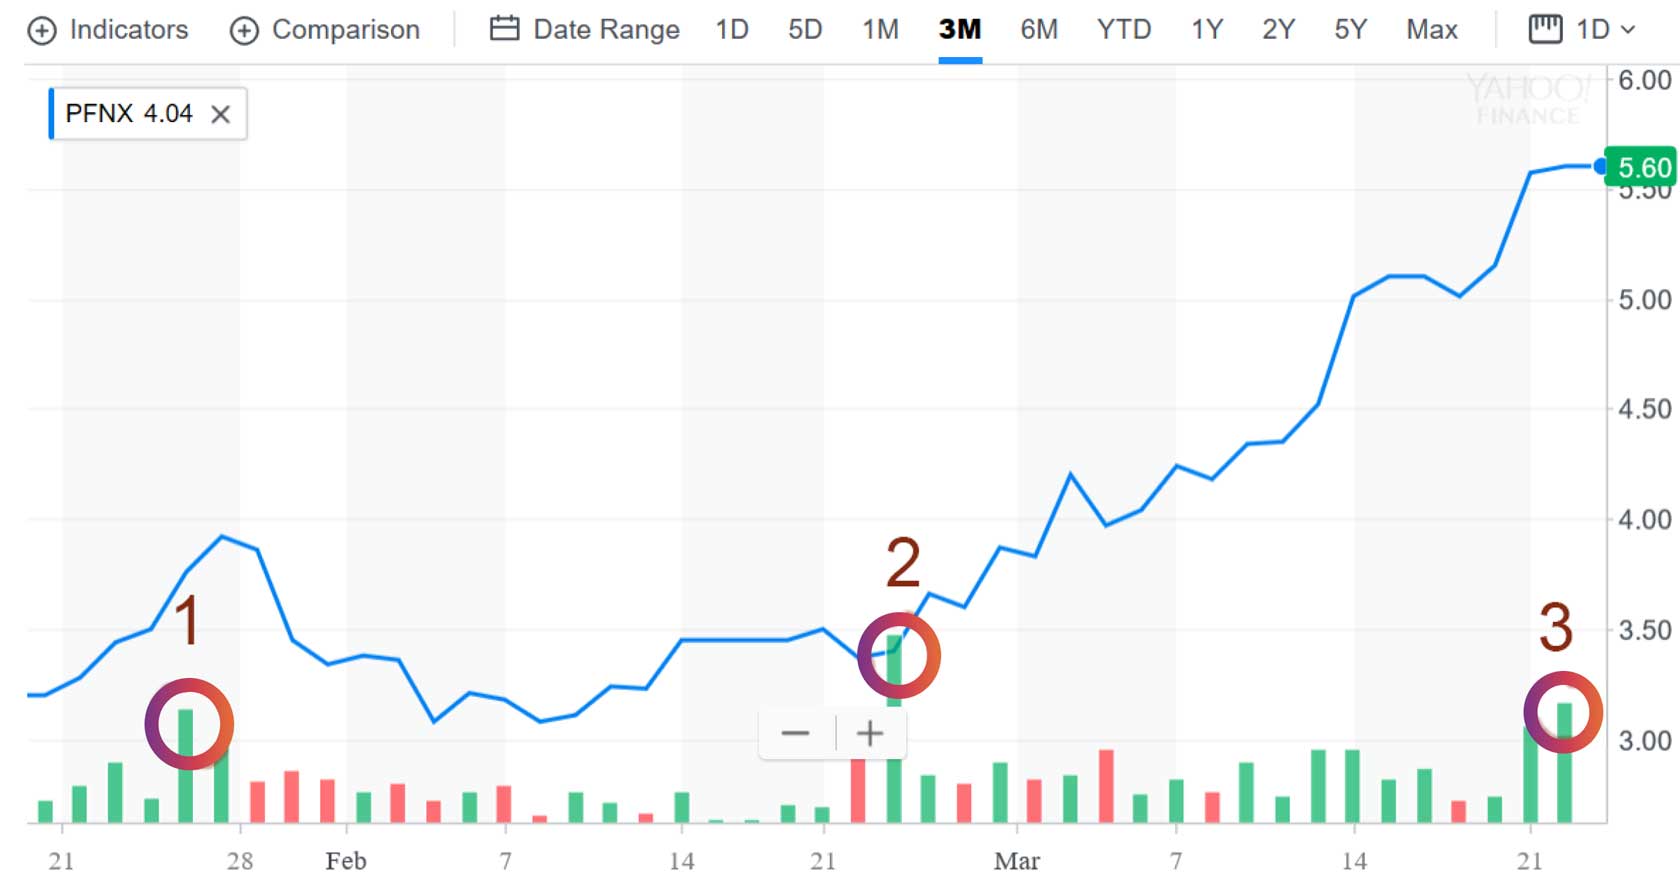
To better understand why this distinction is important, let us give you an example. Imagine you trade stock and see that Volume follows price (which is good). The stock is on an upturn, and from the chart, you can see that the Volume historically has been much higher. This indicates that the stock can keep climbing because daily Volume has been higher in the past. However, in the previous Volume tops, the price was different. Let us imagine 100K stocks were traded at USD 3.50 in the first Volume top, while the price now is USD 5.60. This means that about 40% of the Volume will equal the same Liquidity as in the first volume top. In the first chart below, you will see the Volume as raw bars. Normally, you would like to see the Volume “smooth” to give a more statistically accurate direction, but you can see some general tendencies with bars. In this case, if you are wondering whether to buy the stock or not, from point 1 in the chart, you can see that the stock fell after the high Volume. You can not see the same in point 2, so this gives you the idea that you cannot use Volume as your main indicator in decision-making for this particular stock (using Volume to plot your buy and sell).
However, from a technical analysis point of view, this chart is not as readable as you want it. Therefore, let us look at the same stock using a bit different techniques when working the Volume.
Below is the same chart, but this time we are not using Volume, but Liquidity (Volume * Price) instead.
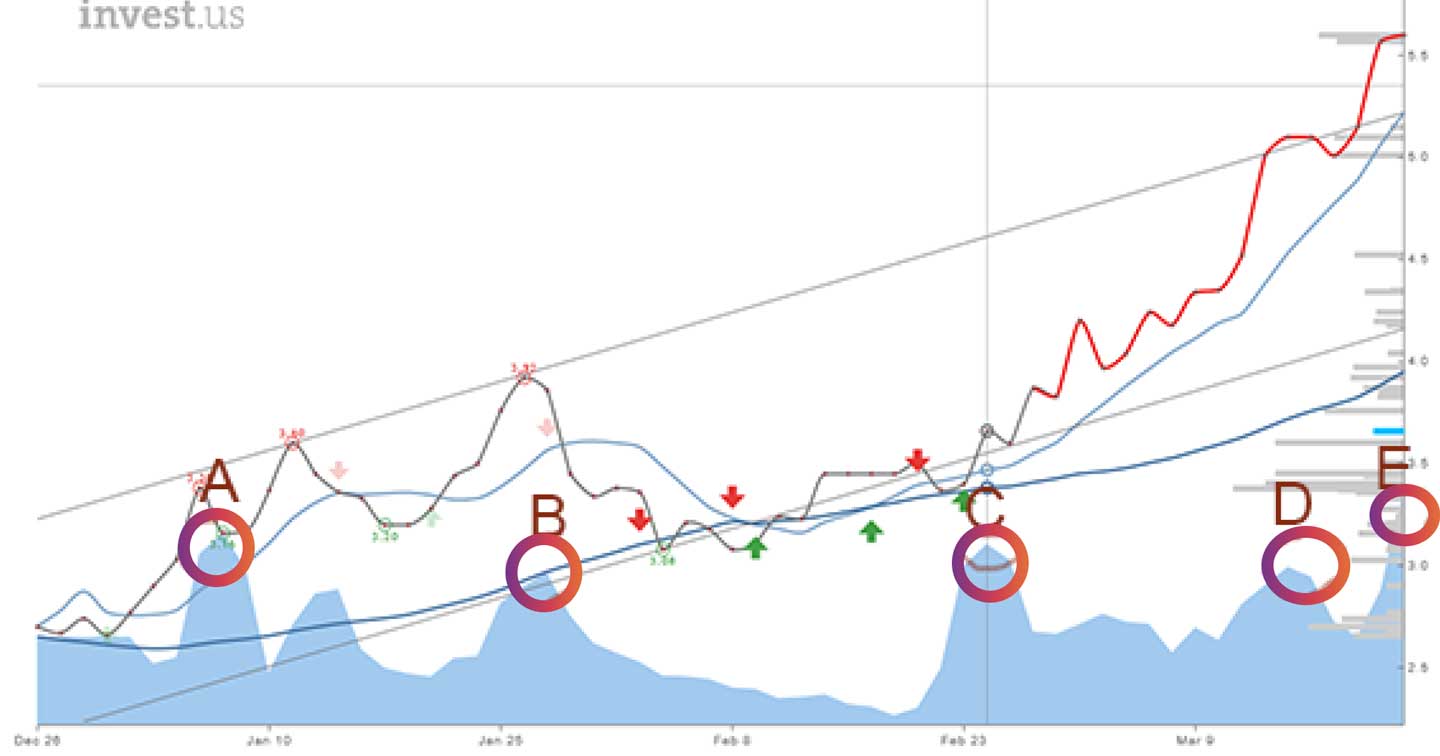
In addition, the Volume is smoothed to give a better idea about the general movements. From this angle, Price and Volume seem to follow each other. In the period between C and E, the Volume remains relatively high as the stock rises. But the question still remains, will it go higher? Cash flows in and out of markets, sectors, and stocks are somewhat limited. There is no infinite amount of cash available. Based on this, and the fact that stock is on a 3-month high (E - Liquidity), the chances for a reaction down is substantial. Based on the Volume/Liquidity indicator, the stock is not a buy at the current level. You can (using a very long history) determine the % probability by looking at what type of reaction the stock got after topping on Volume. In this particular case, the stock fell (B) 1 time, rose © 1 time, and went sideways (A & D) 2 times after topping out on volume/liquidity. In a sloppy statistical way, we can say that it is a 75% chance the stock will either fall or go sideways from this volume top. In neither case, it can justify a buy.
Volume/Liquidity requirements should be defined in your defined strategy to prevent entering low liquid stocks (risk) and as entering and exit points.
Conclusion:
Why would you buy a stock at a very high Volume/Liquidity if history shows that it usually falls back afterward? You may be lucky, but in most cases, you will lose or get stuck in a share that will not yield anytime soon.
Some main rules about Volume:
- Volume should follow Price. If the Price is going up, the Volume should be going up. This will make a stock more predictable and ultimately tradeable;
- Volume price going in different directions is called Divergence and usually indicates a change. This can be the end of a trend, start or end of a signal/formation, etc. Divergence can be considered as a trading option. You have to understand what change it is and act on it;
- Low Volume increases all kinds of risk;
- Volume is presented in many ways. Either just as Volume or as Liquidity. The Liquidity (Volume * Price) version is more “readable” and statistically correct;
- Volume is not unlimited, but it can dry up completely;
- Volume is the primary verifier of all signals and formations.
Some love trading in low-liquid stocks simply because these stocks often have a high spread. It is a game of patience but doable. The spread, in this case, is defined as the distance between the sell offer and the buy offer. It is very common in some stocks to have a 3-10% spread. If you manage to buy on the low and sell on the high, you can profit. You will have to understand the pattern of the stock. Is it opening high and closing low? Meaning you can buy at close and sell on opening the next day?