Beacon Roofing Supply Stock Earnings Report
Current P/E ratio: 23.15 | Price (May 26, 2023, EOD): $67.31 (Find current average P/E ratios for all sectors below)
BECN Upcoming Earnings (Q2 2023)
Earnings Date: | Aug 02, 2023 |
Consensus EPS: | Premium |
BECN Analysts Price Targets
Currently no data available.About Beacon Roofing Supply
Beacon Roofing Supply, Inc., together with its subsidiaries, distributes residential and non-residential roofing materials, and complementary building products to contractors, home builders, building owners, lumberyards, and retailers. It offers pitched roofing and low slope roof products; gutters and sidings; building materials, such as lumber and composite, skylights and window, plywood and OSB, decking and railing, and HVAC products; and foam board, spray foam, roll, batt, mineral wool, fiberglass, and commercial insulation products, as well as radiant barriers and blown-in insulation and equipment. The company also provides above grade and below grade membranes and coatings, deck and floor coatings, plaza deck waterproofing products, damp proofing coatings, and air and vapor barriers; tools and equipment, including power and hand tools, ladders and scaffolding, air tools and compressors, nails, screws and fasteners, generators, work wear and safety gear, job site supplies, tool bags and belts, welding and soldering, cleaning supplies, drill bits, and saw blades; and solar panels, mounting hardware, inverters, and storage and batteries. As of September 30, 2021, it operated approximately 446 branches in 50 states of the United States and 6 provinces in Canada. Beacon Roofing Supply, Inc. was founded in 1928 and is headquartered in Herndon, Virginia.
Last 3 Quarters for BECN Premium
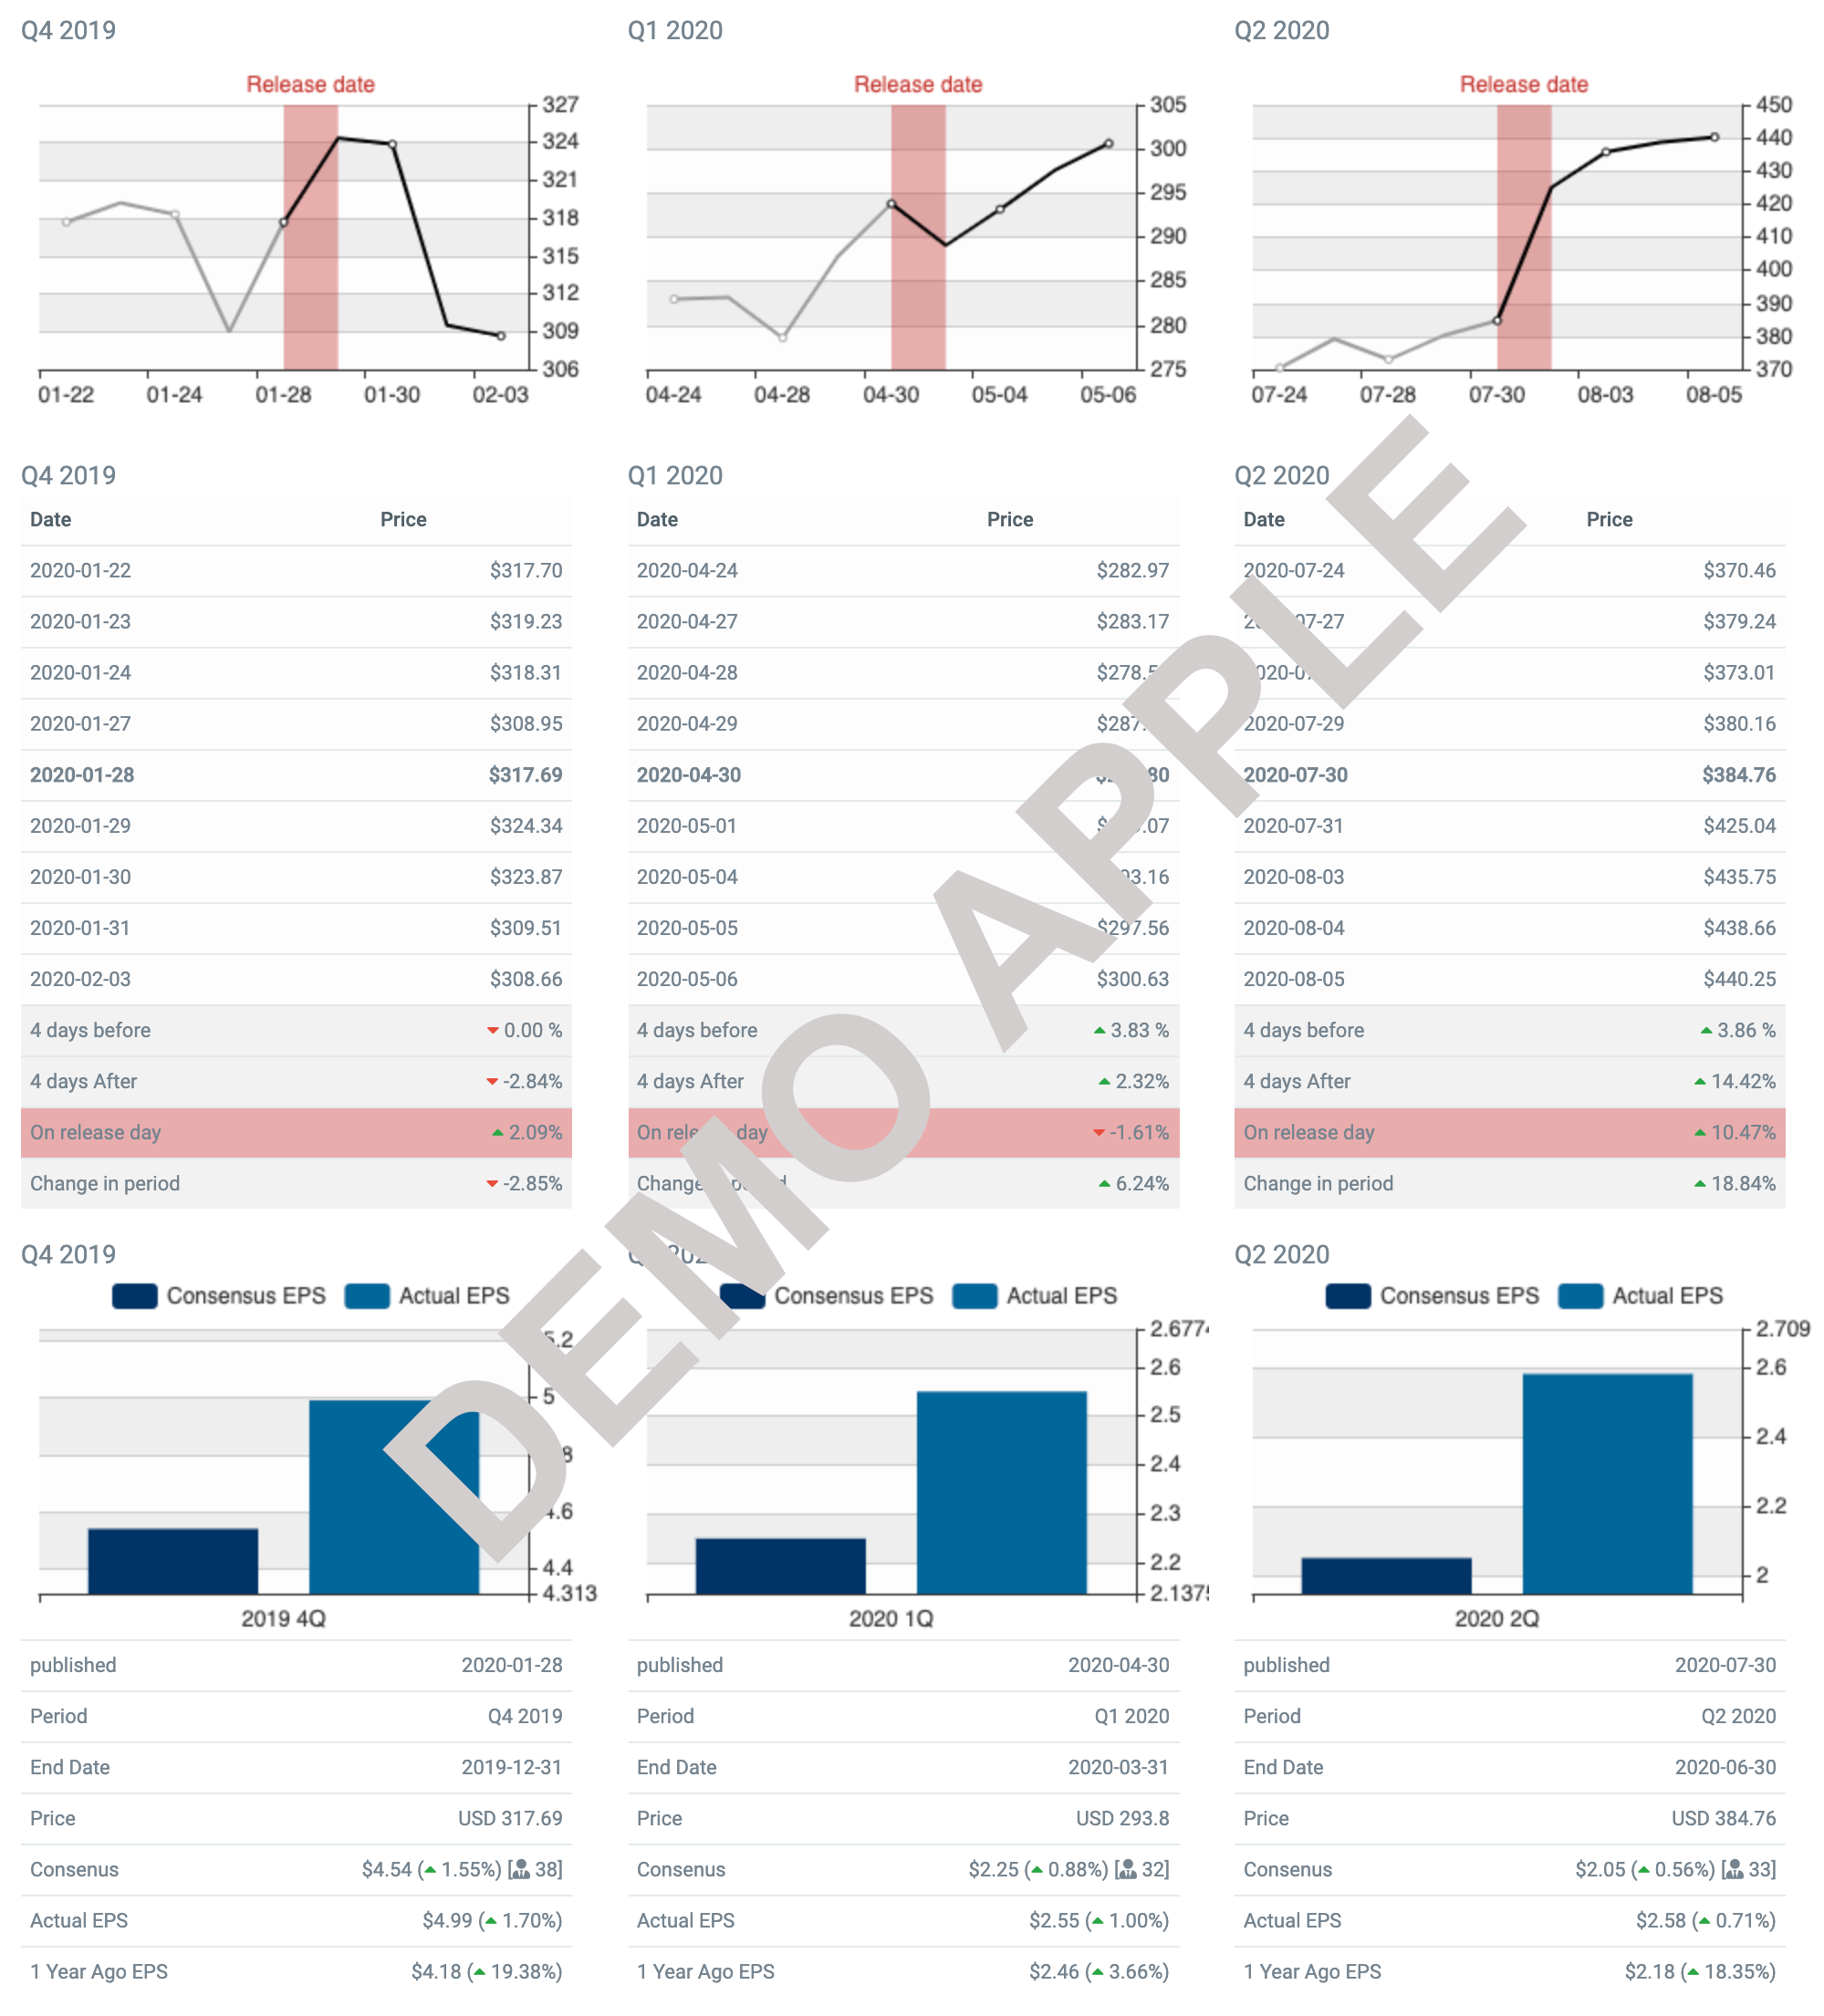
Below you can see how BECN performed 4 days prior and 4 days after releasing the earnings report. Also, you can see the pre-estimates and the actual earnings. This information can give you a slight idea of what you might expect for the next quarter's release.
What Is an Earnings Report?
An earnings report is usually issued quarterly (Q1, Q2, Q3 & Q4) by public companies to report their performance. Earnings reports typically include net income, earnings per share, earnings from continuing operations, and net sales. Looking at the earnings report investors can start gauge the financial health of the company and make even better decisions whether to buy, sell, or stay in the company. Fundamental analysts and value investors will typically hunt for stocks that continue to show good financial ratios and use a decline as an exit point. One of the most anticipated numbers for analysis is earnings per share because it indicates how much the company earned for its shareholders. The report will also indicate a possible dividend.
Earnings Report Content
Earnings reports generally provide an update of all three financial statements, including the income statement, the balance sheet, and the cash flow statement. These figures are typically measured against previous quarters/years. Furthermore, the earnings report usually includes a summary and analysis from the CEO or company spokesman, alongside a more general view of the financials and future forecast.
What To Know About Earnings Reports
Announcement of earnings for a stock, particularly for well followed large-capitalization stocks, can move the market. Stock prices can fluctuate wildly on days when the quarterly earnings report is released. Despite good reports, stocks may very well fall if the investors were expecting more or they believe the next quarter will not be as good. Investors always try to be ahead of the market and future earnings/losses are often discounted into the current price of the stock. It is natural for stocks to start to move in either direction a few days before the release of an earnings report.
Average Sector P/E ratio
Is your stock priced above or below the average P/E ratio?
A higher P/E ratio shows that investors are willing to pay a higher share price today because of growth expectations in the future. For example, a company with a current P/E of 25, trades at 25 times today's earnings.
Name | Number of firms | Average PE |
---|---|---|
Advertising | 47 | 20 |
Aerospace/Defense | 77 | 35 |
Air Transport | 18 | 15 |
Apparel | 51 | 26 |
Auto & Truck | 13 | 15 |
Auto Parts | 46 | 16 |
Bank (Money Center) | 7 | 11 |
Banks (Regional) | 611 | 17 |
Beverage (Alcoholic) | 21 | 38 |
Beverage (Soft) | 34 | 35 |
Broadcasting | 27 | 14 |
Brokerage & Investment Banking | 39 | 14 |
Building Materials | 42 | 23 |
Business & Consumer Services | 165 | 32 |
Cable TV | 14 | 156 |
Chemical (Basic) | 43 | 14 |
Chemical (Diversified) | 6 | 10 |
Chemical (Specialty) | 94 | 25 |
Coal & Related Energy | 22 | 7 |
Computer Services | 106 | 27 |
Computers/Peripherals | 48 | 24 |
Construction Supplies | 44 | 22 |
Diversified | 23 | 45 |
Drugs (Biotechnology) | 503 | 77 |
Drugs (Pharmaceutical) | 267 | 22 |
Education | 35 | 21 |
Electrical Equipment | 113 | 28 |
Electronics (Consumer & Office) | 20 | 18 |
Electronics (General) | 153 | 49 |
Engineering/Construction | 54 | 24 |
Entertainment | 107 | 150 |
Environmental & Waste Services | 82 | 70 |
Farming/Agriculture | 31 | 63 |
Financial Svcs. (Non-bank & Insurance) | 232 | 36 |
Food Processing | 88 | 55 |
Food Wholesalers | 17 | 43 |
Furn/Home Furnishings | 35 | 17 |
Green & Renewable Energy | 22 | 88 |
Healthcare Products | 242 | 160 |
Healthcare Support Services | 128 | 131 |
Heathcare Information and Technology | 129 | 132 |
Homebuilding | 32 | 64 |
Hospitals/Healthcare Facilities | 36 | 145 |
Hotel/Gaming | 65 | 171 |
Household Products | 127 | 26 |
Information Services | 69 | 283 |
Insurance (General) | 19 | 693 |
Insurance (Life) | 24 | 15 |
Insurance (Prop/Cas.) | 51 | 71 |
Investments & Asset Management | 192 | 120 |
Machinery | 120 | 27 |
Metals & Mining | 92 | 37 |
Office Equipment & Services | 22 | 16 |
Oil/Gas (Integrated) | 4 | 13 |
Oil/Gas (Production and Exploration) | 269 | 19 |
Oil/Gas Distribution | 24 | 606 |
Oilfield Svcs/Equip. | 136 | 28 |
Packaging & Container | 24 | 43 |
Paper/Forest Products | 15 | 20 |
Power | 52 | 28 |
Precious Metals | 83 | 98 |
Publishing & Newspapers | 31 | 28 |
R.E.I.T. | 234 | 91 |
Real Estate (Development) | 20 | 146 |
Real Estate (General/Diversified) | 12 | 31 |
Real Estate (Operations & Services) | 57 | 23 |
Recreation | 63 | 50 |
Reinsurance | 2 | 153 |
Restaurant/Dining | 77 | 66 |
Retail (Automotive) | 26 | 20 |
Retail (Building Supply) | 17 | 202 |
Retail (Distributors) | 80 | 28 |
Retail (General) | 18 | 22 |
Retail (Grocery and Food) | 13 | 38 |
Retail (Online) | 70 | 319 |
Retail (Special Lines) | 89 | 25 |
Rubber& Tires | 4 | 15 |
Semiconductor | 72 | 109 |
Semiconductor Equip | 39 | 26 |
Shipbuilding & Marine | 10 | 30 |
Shoe | 11 | 27 |
Software (Entertainment) | 86 | 60 |
Software (Internet) | 30 | 90 |
Software (System & Application) | 363 | 144 |
Steel | 32 | 11 |
Telecom (Wireless) | 18 | 27 |
Telecom. Equipment | 91 | 66 |
Telecom. Services | 67 | 115 |
Tobacco | 17 | 33 |
Transportation | 18 | 24 |
Transportation (Railroads) | 8 | 20 |
Trucking | 33 | 18 |
Utility (General) | 16 | 26 |
Utility (Water) | 17 | 46 |
Total Market | 7053 | 61 |
Total Market (without financials) | 5878 | 62 |
Updated: Jan 2020
About Beacon Roofing Supply
Beacon Roofing Supply, Inc., together with its subsidiaries, distributes residential and non-residential roofing materials, and complementary building products to contractors, home builders, building owners, lumberyards, and retailers. It offers pitched roofing and low slope roof products; gutters and sidings; building materials, such as lumber and composite, skylights and window, plywood and OSB, decking and railing, and HVAC products; and foam ... BECN Profile
Top Fintech Company
featured in The Global Fintech Index 2020 as the top Fintech company of the country.