$144.96 (-1.22%)

Volume: 557.169k

Closed: Jun 05, 2023

Hollow Logo Score: -1.709
F5 Networks Stock
$144.96 (-1.22%)

Volume: 557.169k

Closed: Jun 05, 2023

Score Hollow Logo -1.709
NASDAQ:FFIV

F5 Networks Stock Earnings Report

Current P/E ratio: 29.79 | Price (Jun 05, 2023, EOD): $144.96 (Find current average P/E ratios for all sectors below)

FFIV Upcoming Earnings (Q2 2023)

Earnings Date: Jul 24, 2023
Consensus EPS: Premium

FFIV Analysts Price Targets

Currently no data available.

About F5 Networks

F5 NetworksF5, Inc. provides multi-cloud application security and delivery solutions for the security, performance, and availability of network applications, servers, and storage systems. The company's multi-cloud application security and delivery solutions enable its customers to develop, deploy, operate, secure, and govern applications in any architecture, from on-premises to the public cloud. It offers application security and delivery products, including BIG-IP appliances and VIPRION chassis and related software modules and software-only Virtual Editions; Local Traffic Manager and DNS Services; Advanced Firewall Manager and Policy Enforcement Manager that leverage the unique performance characteristics of its hardware and software architecture; Application Security Manager and Access Policy Manager; NGINX Plus and NGINX Controller; Shape Defense and Enterprise Defense; Secure Web Gateway, and Silverline DDoS and Application security offerings; and online fraud and abuse prevention solutions. The company also provides a range of professional services, including consulting, training, installation, maintenance, and other technical support services. F5, Inc. sells its products to large enterprise businesses, public sector institutions, governments, and service providers through distributors, value-added resellers, managed service providers, and systems integrators in the Americas, Europe, the Middle East, Africa, and the Asia Pacific region. It has partnerships with public cloud providers, such as Amazon Web Services, Microsoft Azure, and Google Cloud Platform. The company was formerly known as F5 Networks, Inc. and changed its name to F5, Inc. in November 2021. F5, Inc. was incorporated in 1996 and is headquartered in Seattle, Washington.

Last 3 Quarters for FFIV Premium

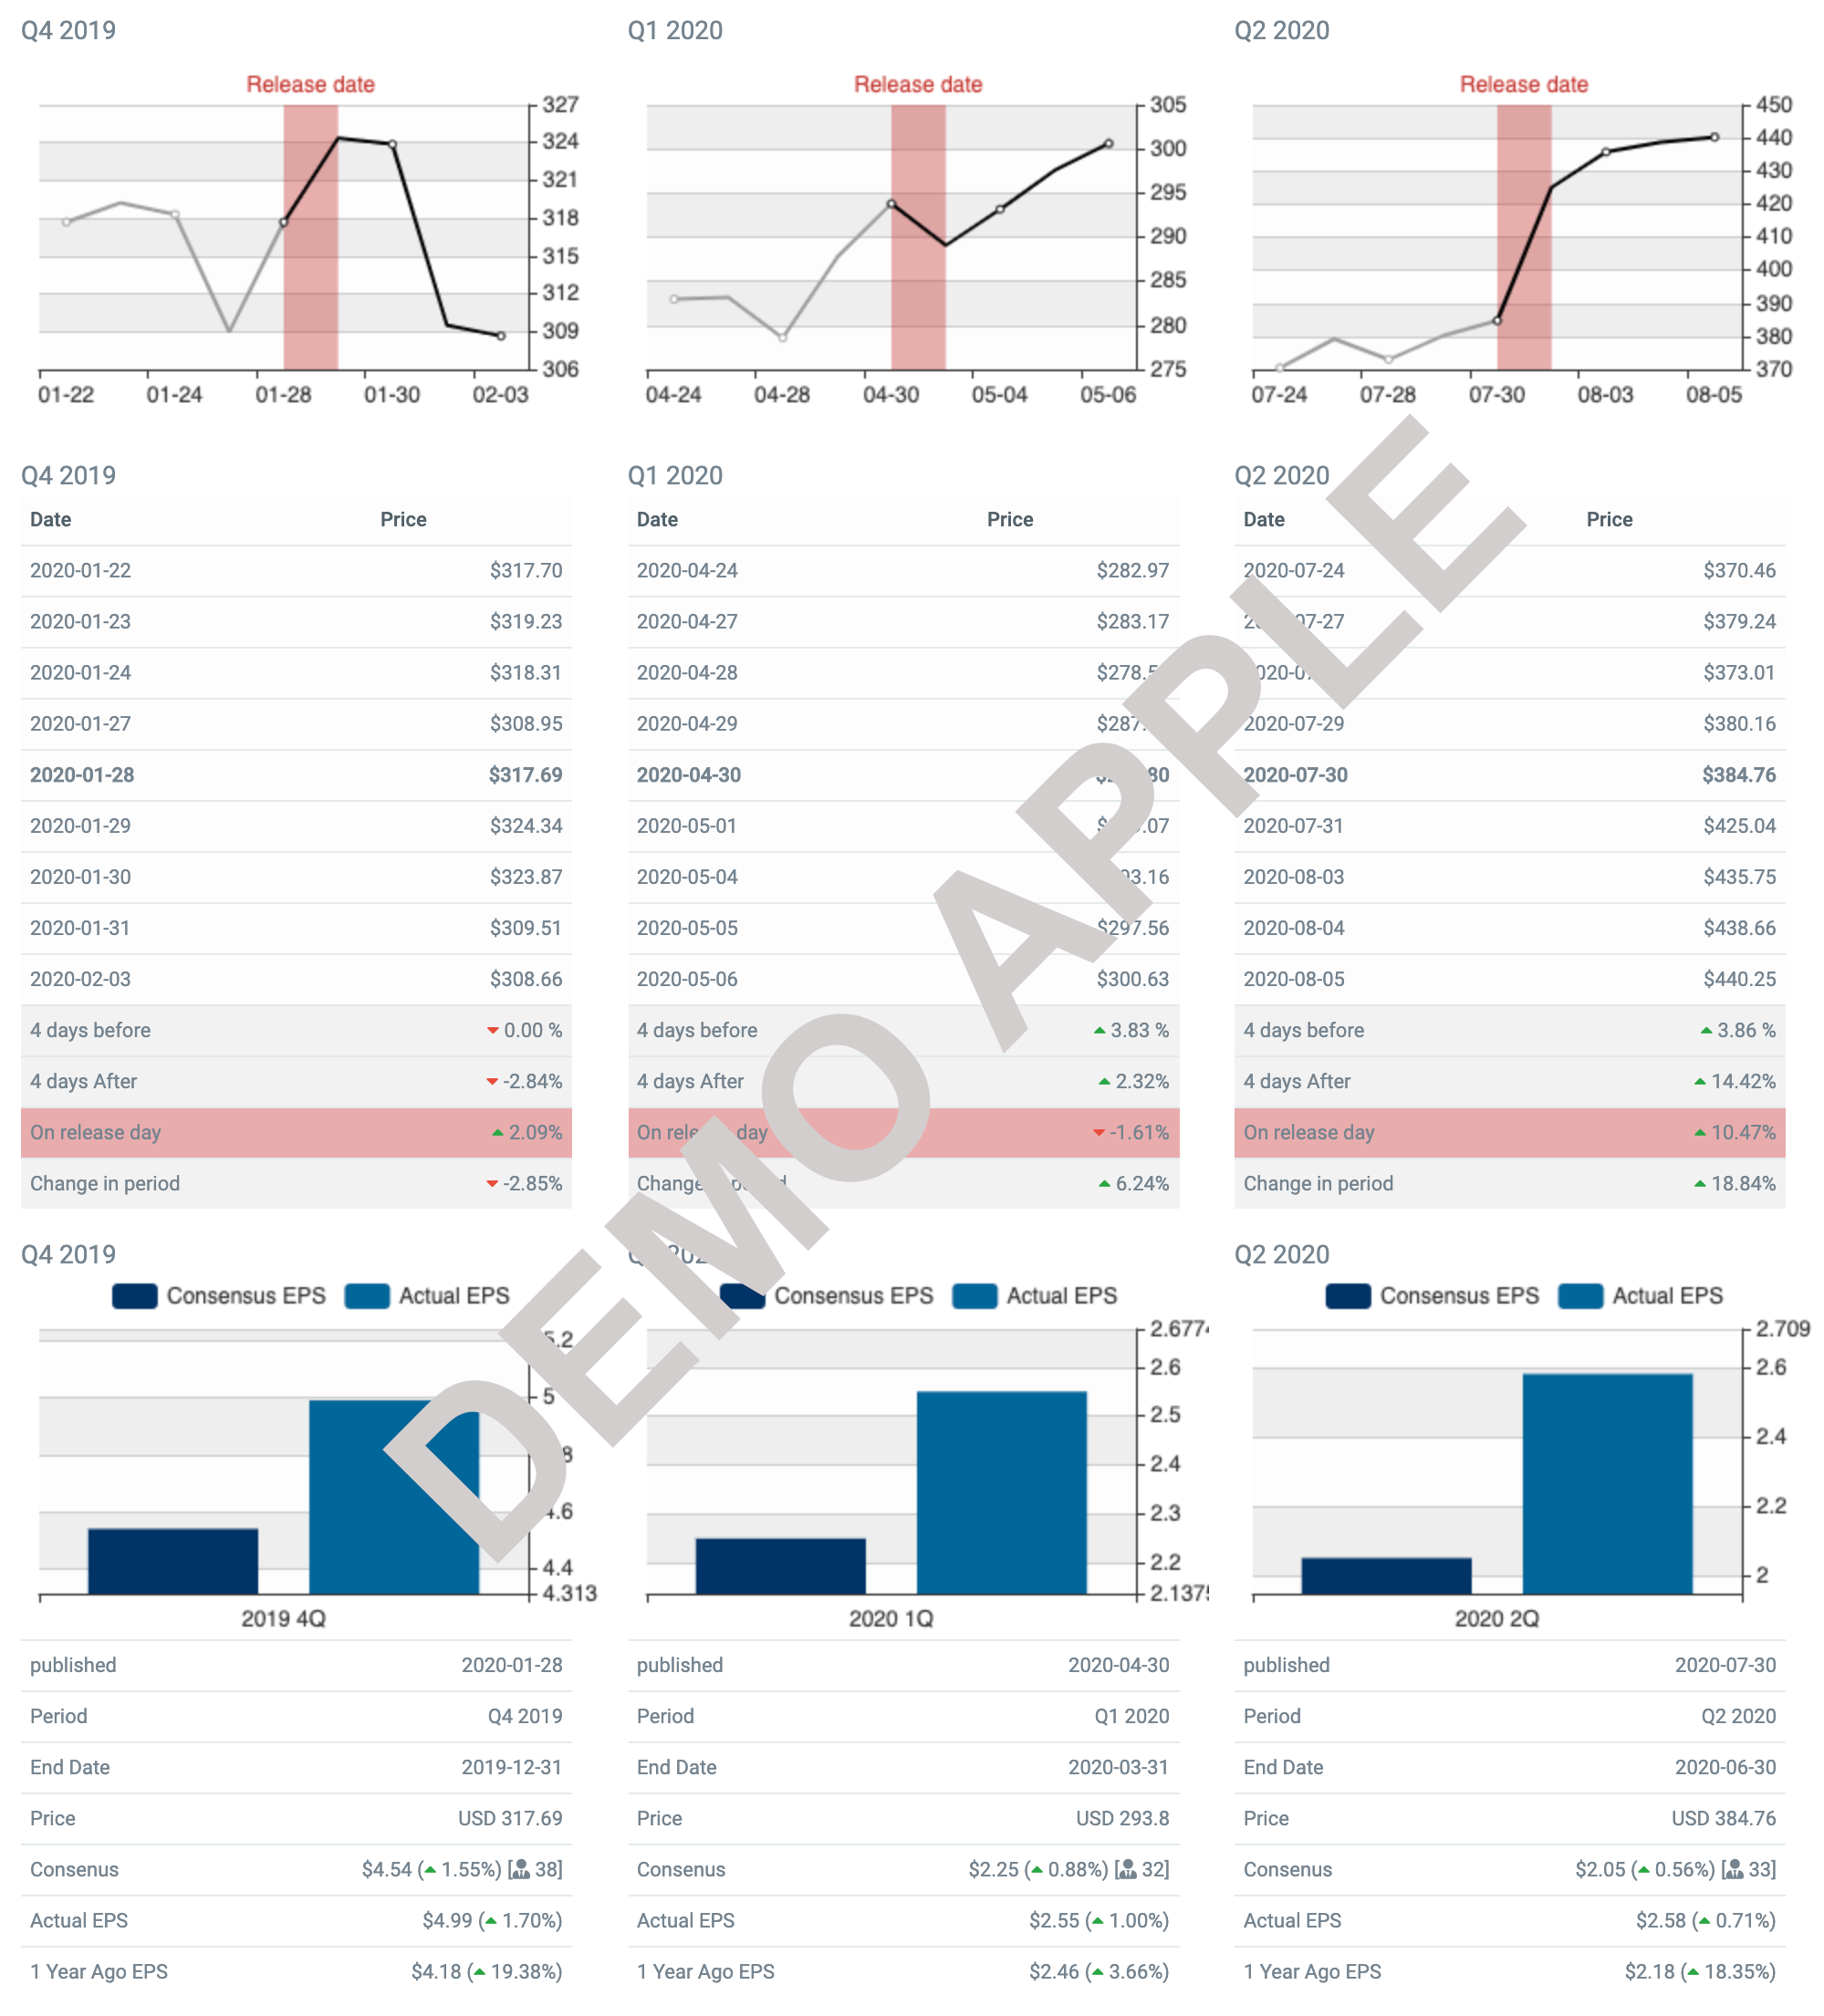
Below you can see how FFIV performed 4 days prior and 4 days after releasing the earnings report. Also, you can see the pre-estimates and the actual earnings. This information can give you a slight idea of what you might expect for the next quarter's release.

Earnings Report Demo

What Is an Earnings Report?

An earnings report is usually issued quarterly (Q1, Q2, Q3 & Q4) by public companies to report their performance. Earnings reports typically include net income, earnings per share, earnings from continuing operations, and net sales. Looking at the earnings report investors can start gauge the financial health of the company and make even better decisions whether to buy, sell, or stay in the company. Fundamental analysts and value investors will typically hunt for stocks that continue to show good financial ratios and use a decline as an exit point. One of the most anticipated numbers for analysis is earnings per share because it indicates how much the company earned for its shareholders. The report will also indicate a possible dividend.

Earnings Report Content

Earnings reports generally provide an update of all three financial statements, including the income statement, the balance sheet, and the cash flow statement. These figures are typically measured against previous quarters/years. Furthermore, the earnings report usually includes a summary and analysis from the CEO or company spokesman, alongside a more general view of the financials and future forecast.

What To Know About Earnings Reports

Announcement of earnings for a stock, particularly for well followed large-capitalization stocks, can move the market. Stock prices can fluctuate wildly on days when the quarterly earnings report is released. Despite good reports, stocks may very well fall if the investors were expecting more or they believe the next quarter will not be as good. Investors always try to be ahead of the market and future earnings/losses are often discounted into the current price of the stock. It is natural for stocks to start to move in either direction a few days before the release of an earnings report.

Average Sector P/E ratio

Is your stock priced above or below the average P/E ratio?

A higher P/E ratio shows that investors are willing to pay a higher share price today because of growth expectations in the future. For example, a company with a current P/E of 25, trades at 25 times today's earnings.

Name Number of firms Average PE
Advertising 47 20
Aerospace/Defense 77 35
Air Transport 18 15
Apparel 51 26
Auto & Truck 13 15
Auto Parts 46 16
Bank (Money Center) 7 11
Banks (Regional) 611 17
Beverage (Alcoholic) 21 38
Beverage (Soft) 34 35
Broadcasting 27 14
Brokerage & Investment Banking 39 14
Building Materials 42 23
Business & Consumer Services 165 32
Cable TV 14 156
Chemical (Basic) 43 14
Chemical (Diversified) 6 10
Chemical (Specialty) 94 25
Coal & Related Energy 22 7
Computer Services 106 27
Computers/Peripherals 48 24
Construction Supplies 44 22
Diversified 23 45
Drugs (Biotechnology) 503 77
Drugs (Pharmaceutical) 267 22
Education 35 21
Electrical Equipment 113 28
Electronics (Consumer & Office) 20 18
Electronics (General) 153 49
Engineering/Construction 54 24
Entertainment 107 150
Environmental & Waste Services 82 70
Farming/Agriculture 31 63
Financial Svcs. (Non-bank & Insurance) 232 36
Food Processing 88 55
Food Wholesalers 17 43
Furn/Home Furnishings 35 17
Green & Renewable Energy 22 88
Healthcare Products 242 160
Healthcare Support Services 128 131
Heathcare Information and Technology 129 132
Homebuilding 32 64
Hospitals/Healthcare Facilities 36 145
Hotel/Gaming 65 171
Household Products 127 26
Information Services 69 283
Insurance (General) 19 693
Insurance (Life) 24 15
Insurance (Prop/Cas.) 51 71
Investments & Asset Management 192 120
Machinery 120 27
Metals & Mining 92 37
Office Equipment & Services 22 16
Oil/Gas (Integrated) 4 13
Oil/Gas (Production and Exploration) 269 19
Oil/Gas Distribution 24 606
Oilfield Svcs/Equip. 136 28
Packaging & Container 24 43
Paper/Forest Products 15 20
Power 52 28
Precious Metals 83 98
Publishing & Newspapers 31 28
R.E.I.T. 234 91
Real Estate (Development) 20 146
Real Estate (General/Diversified) 12 31
Real Estate (Operations & Services) 57 23
Recreation 63 50
Reinsurance 2 153
Restaurant/Dining 77 66
Retail (Automotive) 26 20
Retail (Building Supply) 17 202
Retail (Distributors) 80 28
Retail (General) 18 22
Retail (Grocery and Food) 13 38
Retail (Online) 70 319
Retail (Special Lines) 89 25
Rubber& Tires 4 15
Semiconductor 72 109
Semiconductor Equip 39 26
Shipbuilding & Marine 10 30
Shoe 11 27
Software (Entertainment) 86 60
Software (Internet) 30 90
Software (System & Application) 363 144
Steel 32 11
Telecom (Wireless) 18 27
Telecom. Equipment 91 66
Telecom. Services 67 115
Tobacco 17 33
Transportation 18 24
Transportation (Railroads) 8 20
Trucking 33 18
Utility (General) 16 26
Utility (Water) 17 46
Total Market 7053 61
Total Market (without financials) 5878 62

Updated: Jan 2020

Click to get the best stock tips daily for free!

About F5 Networks

F5 Networks F5, Inc. provides multi-cloud application security and delivery solutions for the security, performance, and availability of network applications, servers, and storage systems. The company's multi-cloud application security and delivery solutions enable its customers to develop, deploy, operate, secure, and govern applications in any architecture, from on-premises to the public cloud. It offers application security and delivery products, includin... FFIV Profile

Top Fintech Company

StockInvest.us featured in The Global Fintech Index 2020 as the top Fintech company of the country.

Full report by FINDEXABLE

ROCKIT