$1.36 (0.741%)

Volume: 42.223k

Closed: May 26, 2023

Hollow Logo Score: 2.599
Fuel Tech Stock
$1.36 (0.741%)

Volume: 42.223k

Closed: May 26, 2023

Score Hollow Logo 2.599
NASDAQ:FTEK

Fuel Tech Stock Earnings Report

Current P/E ratio: 854.79 | Price (May 26, 2023, EOD): $1.36 (Find current average P/E ratios for all sectors below)

FTEK Upcoming Earnings (Q2 2023)

Earnings Date: Aug 08, 2023
Consensus EPS: Premium

FTEK Analysts Price Targets

Currently no data available.

About Fuel Tech

Fuel Tech, Inc. provides boiler optimization, efficiency improvement, and air pollution reduction and control solutions to utility and industrial customers worldwide. It operates through two segments, Air Pollution Control Technology and FUEL CHEM Technology. The Air Pollution Control Technology segment offers technologies to reduce nitrogen oxide (NOx) emissions in flue gas from boilers, incinerators, furnaces, and other stationary combustion sources by low and ultra-low NOx burners; over-fire air systems; NOxOUT and HERT selective non-catalytic reduction systems; selective catalytic reduction systems comprising ammonia injection grid, and graduated straightening grid systems; I-NOx systems; ESP Processes and Services; ULTRA technology; and flue gas conditioning systems; and burner systems. The FUEL CHEM Technology segment provides programs to improve the efficiency, reliability, fuel flexibility, boiler heat rate, and environmental status of combustion units by controlling slagging, fouling, corrosion, opacity, and acid plume, as well as the formation of sulfur trioxide, ammonium bisulfate, particulate matter, sulfur dioxide, and carbon dioxide through the addition of chemicals into the furnace using TIFI targeted in-furnace injection technology. This segment offers its FUEL CHEM program for plants operating in the electric utility, industrial, pulp and paper, waste-to-energy, and university and district heating markets; and the owners of boilers, furnaces, and other combustion units. The company was incorporated in 1987 and is headquartered in Warrenville, Illinois.

Last 3 Quarters for FTEK Premium

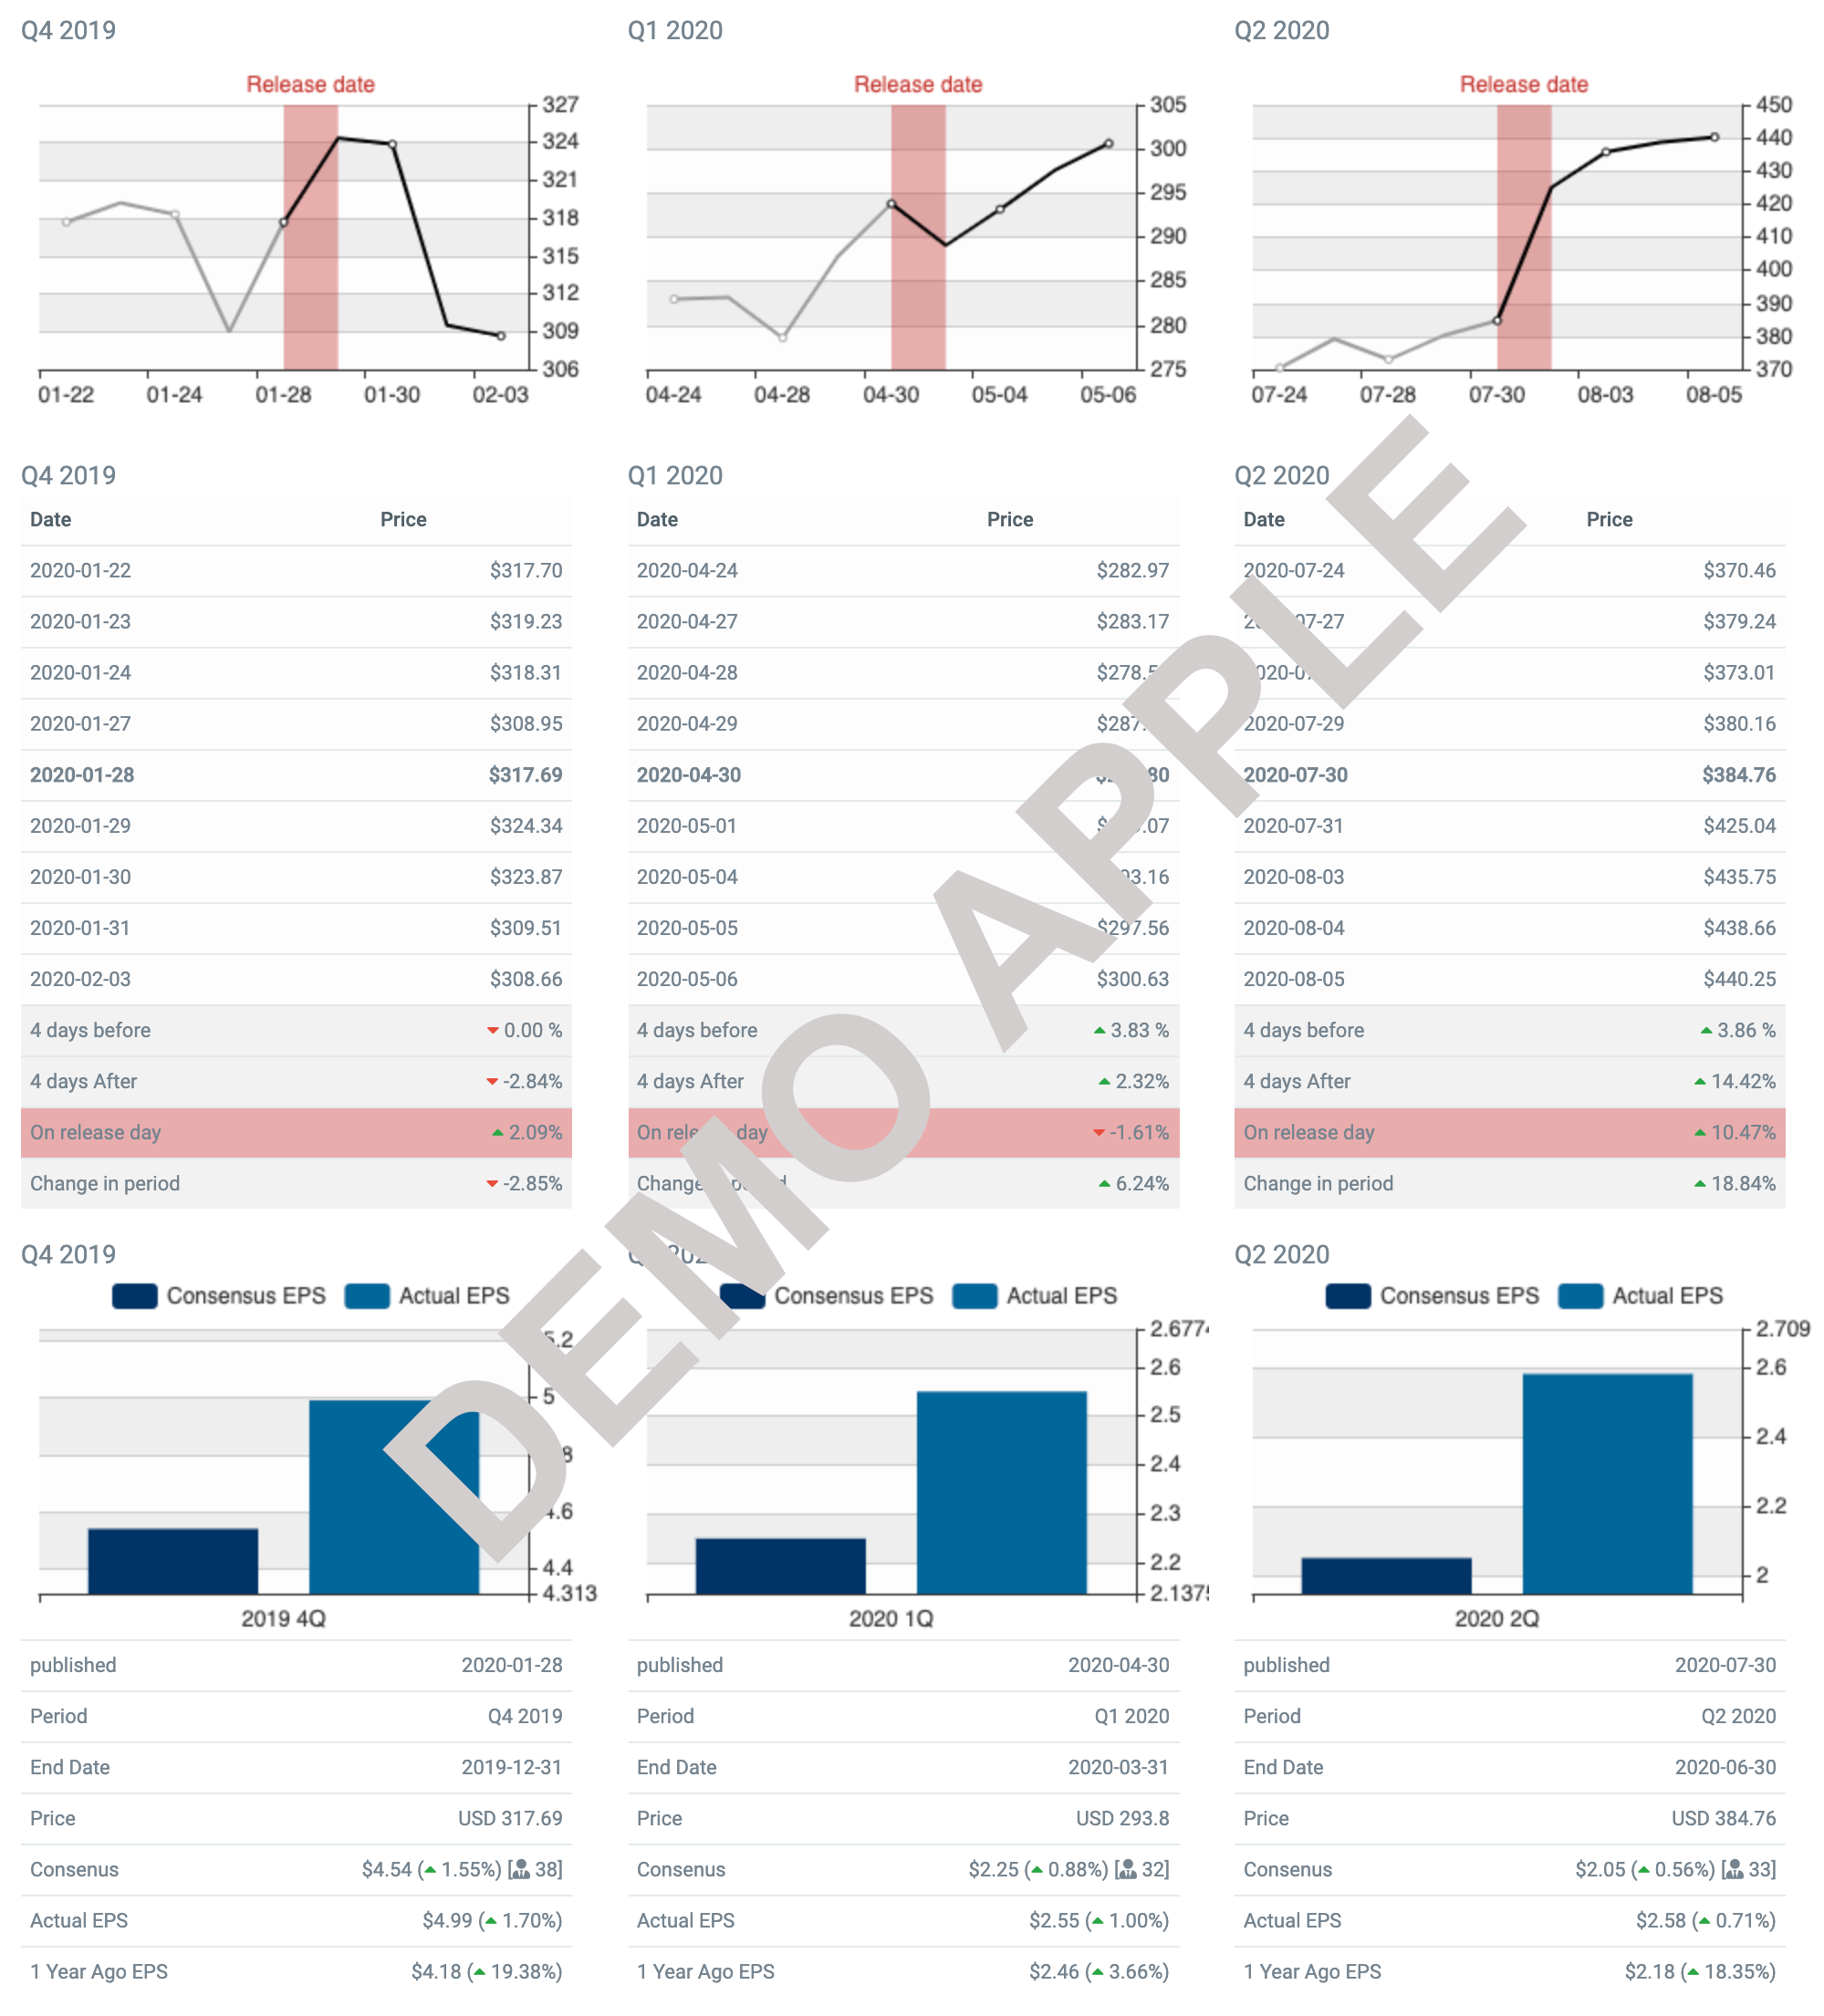
Below you can see how FTEK performed 4 days prior and 4 days after releasing the earnings report. Also, you can see the pre-estimates and the actual earnings. This information can give you a slight idea of what you might expect for the next quarter's release.

Earnings Report Demo

What Is an Earnings Report?

An earnings report is usually issued quarterly (Q1, Q2, Q3 & Q4) by public companies to report their performance. Earnings reports typically include net income, earnings per share, earnings from continuing operations, and net sales. Looking at the earnings report investors can start gauge the financial health of the company and make even better decisions whether to buy, sell, or stay in the company. Fundamental analysts and value investors will typically hunt for stocks that continue to show good financial ratios and use a decline as an exit point. One of the most anticipated numbers for analysis is earnings per share because it indicates how much the company earned for its shareholders. The report will also indicate a possible dividend.

Earnings Report Content

Earnings reports generally provide an update of all three financial statements, including the income statement, the balance sheet, and the cash flow statement. These figures are typically measured against previous quarters/years. Furthermore, the earnings report usually includes a summary and analysis from the CEO or company spokesman, alongside a more general view of the financials and future forecast.

What To Know About Earnings Reports

Announcement of earnings for a stock, particularly for well followed large-capitalization stocks, can move the market. Stock prices can fluctuate wildly on days when the quarterly earnings report is released. Despite good reports, stocks may very well fall if the investors were expecting more or they believe the next quarter will not be as good. Investors always try to be ahead of the market and future earnings/losses are often discounted into the current price of the stock. It is natural for stocks to start to move in either direction a few days before the release of an earnings report.

Average Sector P/E ratio

Is your stock priced above or below the average P/E ratio?

A higher P/E ratio shows that investors are willing to pay a higher share price today because of growth expectations in the future. For example, a company with a current P/E of 25, trades at 25 times today's earnings.

Name Number of firms Average PE
Advertising 47 20
Aerospace/Defense 77 35
Air Transport 18 15
Apparel 51 26
Auto & Truck 13 15
Auto Parts 46 16
Bank (Money Center) 7 11
Banks (Regional) 611 17
Beverage (Alcoholic) 21 38
Beverage (Soft) 34 35
Broadcasting 27 14
Brokerage & Investment Banking 39 14
Building Materials 42 23
Business & Consumer Services 165 32
Cable TV 14 156
Chemical (Basic) 43 14
Chemical (Diversified) 6 10
Chemical (Specialty) 94 25
Coal & Related Energy 22 7
Computer Services 106 27
Computers/Peripherals 48 24
Construction Supplies 44 22
Diversified 23 45
Drugs (Biotechnology) 503 77
Drugs (Pharmaceutical) 267 22
Education 35 21
Electrical Equipment 113 28
Electronics (Consumer & Office) 20 18
Electronics (General) 153 49
Engineering/Construction 54 24
Entertainment 107 150
Environmental & Waste Services 82 70
Farming/Agriculture 31 63
Financial Svcs. (Non-bank & Insurance) 232 36
Food Processing 88 55
Food Wholesalers 17 43
Furn/Home Furnishings 35 17
Green & Renewable Energy 22 88
Healthcare Products 242 160
Healthcare Support Services 128 131
Heathcare Information and Technology 129 132
Homebuilding 32 64
Hospitals/Healthcare Facilities 36 145
Hotel/Gaming 65 171
Household Products 127 26
Information Services 69 283
Insurance (General) 19 693
Insurance (Life) 24 15
Insurance (Prop/Cas.) 51 71
Investments & Asset Management 192 120
Machinery 120 27
Metals & Mining 92 37
Office Equipment & Services 22 16
Oil/Gas (Integrated) 4 13
Oil/Gas (Production and Exploration) 269 19
Oil/Gas Distribution 24 606
Oilfield Svcs/Equip. 136 28
Packaging & Container 24 43
Paper/Forest Products 15 20
Power 52 28
Precious Metals 83 98
Publishing & Newspapers 31 28
R.E.I.T. 234 91
Real Estate (Development) 20 146
Real Estate (General/Diversified) 12 31
Real Estate (Operations & Services) 57 23
Recreation 63 50
Reinsurance 2 153
Restaurant/Dining 77 66
Retail (Automotive) 26 20
Retail (Building Supply) 17 202
Retail (Distributors) 80 28
Retail (General) 18 22
Retail (Grocery and Food) 13 38
Retail (Online) 70 319
Retail (Special Lines) 89 25
Rubber& Tires 4 15
Semiconductor 72 109
Semiconductor Equip 39 26
Shipbuilding & Marine 10 30
Shoe 11 27
Software (Entertainment) 86 60
Software (Internet) 30 90
Software (System & Application) 363 144
Steel 32 11
Telecom (Wireless) 18 27
Telecom. Equipment 91 66
Telecom. Services 67 115
Tobacco 17 33
Transportation 18 24
Transportation (Railroads) 8 20
Trucking 33 18
Utility (General) 16 26
Utility (Water) 17 46
Total Market 7053 61
Total Market (without financials) 5878 62

Updated: Jan 2020

Click to get the best stock tips daily for free!

About Fuel Tech

Fuel Tech, Inc. provides boiler optimization, efficiency improvement, and air pollution reduction and control solutions to utility and industrial customers worldwide. It operates through two segments, Air Pollution Control Technology and FUEL CHEM Technology. The Air Pollution Control Technology segment offers technologies to reduce nitrogen oxide (NOx) emissions in flue gas from boilers, incinerators, furnaces, and other stationary combustion so... FTEK Profile

Top Fintech Company

StockInvest.us featured in The Global Fintech Index 2020 as the top Fintech company of the country.

Full report by FINDEXABLE

ROCKIT