14-day Premium Trial Subscription Try For FreeTry Free
NASDAQ:CDEV
Delisted

Centennial Resource Development Inc Stock Forecast

$10.81
-0.185 (-1.68%)
At Close: Jan 27, 2023

Explanation to Bollinger's Bands

Bollinger Bands was created by John Bollinger in the early 1980s, its purpose is to define price action relative to the assets highs and lows. This technical indicator is used to identify buy and sell signals and has proven very well in doing so.

Bollinger Bands consist of a set of three curves drawn in relation to securities prices. The middle band is a measure of the intermediate-term trend, usually a simple moving average, that serves as the base for the upper and lower bands. The interval between the upper and lower bands and the middle band is determined by volatility, typically the standard deviation of the same data that were used for the average. StockInvest.us uses Bollingers suggested 20 day average.

Middle Bollinger Band = 20-period simple moving average
Upper Bollinger Band = Middle Bollinger Band + 2 * 20-period standard deviation
Lower Bollinger Band = Middle Bollinger Band - 2 * 20-period standard deviation

BandWidth defines the current width of the band.
%b defines the current position within the band.

BandWidth = (Upper Bollinger Band - Lower Bollinger Band) / Middle Bollinger Band
%b = (Last - Lower Bollinger Band) / (Upper Bollinger Band - Lower Bollinger Band)

Live Samples:
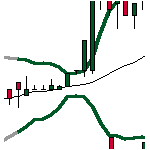
Bollinger Bottleneck Buy Pattern 1
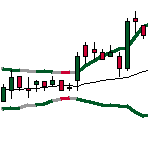
Bollinger Bottleneck Buy Pattern 2
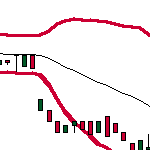
Bollinger Bottleneck Sell Pattern

Bottlenecks in bandwidth indicate an upcoming change. Break up through the moving average line or continuous movements above the moving average line indicate a break up, and vice versa.

Source: http://www.bollingerbands.com

RSI low/high Values: [ 25 - 80 ]
* StockInvest.us uses dynamically calculated RSI max/min levels to determine when stock is oversold or overbought based on historical behavior.

FAQ

What is the symbol for Centennial Resource Development Inc Stock and on which exchange is it traded?
The symbol for Centennial Resource Development Inc is CDEV and it is traded on the NASDAQ (NASDAQ Stock Exchange).

Should I buy or sell Centennial Resource Development Inc Stock?
Centennial Resource Development Inc holds several positive signals, but we still don't find these to be enough for a buy candidate. At the current level, it should be considered as a hold candidate (hold or accumulate) in this position whilst awaiting further development.

How to buy Centennial Resource Development Inc Stock?
Centennial Resource Development Inc Stock can be purchased through just about any brokerage firm, including online brokerage services.
Click here for our free guide on how to buy Centennial Resource Development Inc Stock.

What's the current price of Centennial Resource Development Inc Stock?
As of the end of day on the Jan 27, 2023, the price of an Centennial Resource Development Inc (CDEV) share was $10.81.

What is the 52-week high and low for Centennial Resource Development Inc Stock?
The 52-week high for Centennial Resource Development Inc Stock is $11.16 and the 52-week low is $5.08.

What is the market capitalization of Centennial Resource Development Inc Stock?
As of the Jan 27, 2023, the market capitalization of Centennial Resource Development Inc is 4.181B.
Click to get the best stock tips daily for free!

About Centennial Resource Development Inc

Centennial Resource Development Centennial Resource Development, Inc., an independent oil and natural gas company, focuses on the development of crude oil and related liquids-rich natural gas reserves in the United States. Its assets primarily focus on the Delaware Basin, a sub-basin of the Permian Basin. The company's properties consist of acreage blocks primarily in Reeves County, West Texas and Lea County, New Mexico. As of December 31, 2021, it leased or acquired approximat... CDEV Profile

Top Fintech Company

StockInvest.us featured in The Global Fintech Index 2020 as the top Fintech company of the country.

Full report by FINDEXABLE

ROCKIT