FRANKLIN CREDIT Stock Forecast
Explanation to Bollinger's Bands
Bollinger Bands was created by John Bollinger in the early 1980s, its purpose is to define price action relative to the assets highs and lows. This technical indicator is used to identify buy and sell signals and has proven very well in doing so.
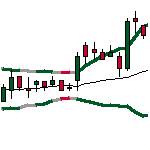
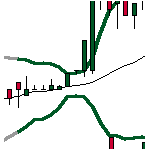
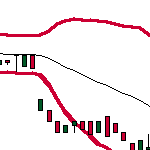
Bollinger Bands consist of a set of three curves drawn in relation to securities prices. The middle band is a measure of the intermediate-term trend, usually a simple moving average, that serves as the base for the upper and lower bands. The interval between the upper and lower bands and the middle band is determined by volatility, typically the standard deviation of the same data that were used for the average. StockInvest.us uses Bollingers suggested 20 day average.
Middle Bollinger Band = 20-period simple moving average
Upper Bollinger Band = Middle Bollinger Band + 2 * 20-period standard deviation
Lower Bollinger Band = Middle Bollinger Band - 2 * 20-period standard deviation
BandWidth defines the current width of the band.
%b defines the current position within the band.
BandWidth = (Upper Bollinger Band - Lower Bollinger Band) / Middle Bollinger Band
%b = (Last - Lower Bollinger Band) / (Upper Bollinger Band - Lower Bollinger Band)
Live Samples:


Bottlenecks in bandwidth indicate an upcoming change. Break up through the moving average line or continuous movements above the moving average line indicate a break up, and vice versa.
Source: http://www.bollingerbands.com
Notice: Technical analysis is hidden due to insufficient data.
There can be multiple reasons for our algorithm to not provide conclusion. One of them can be low or no liquidity.
If you think this is not correct, please
FCRM Dividend Payout History
| # | Ex-Date | Pay Date | Amount | Yield | |
|---|---|---|---|---|---|
| 1 | Sep 20, 2019 | Oct 03, 2019 | Oct 25, 2019 | £1.46 | 6.10% |
| 2 | Dec 04, 2018 | Dec 27, 2018 | Jan 25, 2019 | £0.732 | 1.64% |
| 3 | Jun 05, 2018 | Sep 27, 2018 | Oct 26, 2018 | £1.37 | 2.64% |
| 4 | Dec 05, 2017 | Dec 28, 2017 | Jan 26, 2018 | £0.684 | 1.12% |
| 5 | Jun 06, 2017 | Sep 28, 2017 | Oct 27, 2017 | £1.27 | 2.11% |
FAQ
Click here for our free guide on how to buy FRANKLIN CREDIT Stock.

