FB Financial Corp Stock Forecast
FB Financial Corp stock price up 0.0258% on Friday
(Updated on May 10, 2024)
The FB Financial Corp stock price gained 0.0258% on the last trading day (Friday, 10th May 2024), rising from $38.82 to $38.83. It has now gained 3 days in a row. It will be exciting to see whether it manages to continue gaining or take a minor break for the next few days. During the last trading day the stock fluctuated 1.84% from a day low at $38.42 to a day high of $39.12. The price has risen in 7 of the last 10 days and is up by 2.45% over the past 2 weeks. Volume fell on the last day by -66 thousand shares and in total, 39 thousand shares were bought and sold for approximately $1.51 million. You should take into consideration that falling volume on higher prices causes divergence and may be an early warning about possible changes over the next couple of days.
The stock has broken the wide and weak rising the short-term trend up and an even stronger rate of rising is indicated. For any reaction back there will now be support on the roof on the current trend broken at $38.77, a level that may pose a second chance to hit a runner. According to fan-theory $42.32 will be the next possible trend-top level and thereby pose a resistance level that may not be broken at the first attempt.
Ready to grow your portfolio? Here's your beginner's guide to opening a free brokerage account.
FBK Signals & Forecast
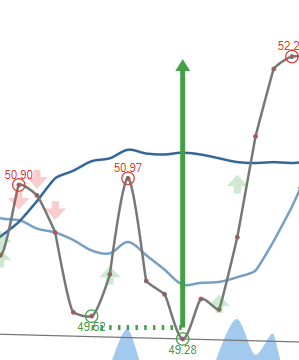
Mostly positive signals in the chart today. The FB Financial Corp stock holds buy signals from both short and long-term Moving Averages giving a positive forecast for the stock. Also, there is a general buy signal from the relation between the two signals where the short-term average is above the long-term average. On corrections down, there will be some support from the lines at $38.59 and $36.92. A breakdown below any of these levels will issue sell signals. A buy signal was issued from a pivot bottom point on Friday, April 12, 2024, and so far it has risen 12.62%. Further rise is indicated until a new top pivot has been found. Furthermore, there is a buy signal from the 3 month Moving Average Convergence Divergence (MACD). Volume fell during the last trading day despite gaining prices. This causes a divergence between volume and price and it may be an early warning. The stock should be watched closely.
 A buy signal from a double bottom formation was found on Friday, April 12, 2024 and based on theory for this formation the price should go up by 2.97% to $39.98 within 18 trading days since signal was issued (Monday, May 13, 2024).
Support, Risk & Stop-loss for FB Financial Corp stock
FB Financial Corp finds support from accumulated volume at $37.65 and this level may hold a buying opportunity as an upwards reaction can be expected when the support is being tested.
This stock has average movements during the day and with good trading volume, the risk is considered to be medium. During the last day, the stock moved $0.705 between high and low, or 1.84%. For the last week, the stock has had daily average volatility of 1.83%.
Our recommended stop-loss: $36.77 (-5.30%) (This stock has medium daily movements and this gives medium risk. There is a buy signal from a pivot bottom found 20 days ago.)
Trading Expectations (FBK) For The Upcoming Trading Day Of Monday 13th
For the upcoming trading day on Monday, 13th we expect FB Financial Corp to open at $38.79, and during the day (based on 14 day Average True Range), to move between $37.88 and $39.78, which gives a possible trading interval of +/-$0.95 (+/-2.45%) up or down from last closing price. If FB Financial Corp takes out the full calculated possible swing range there will be an estimated 4.91% move between the lowest and the highest trading price during the day.
With no resistance above and support from accumulated volume @ $37.65, some $1.18 (3.04%) from the current price of $38.83, our system finds the risk reward attractive.
Is FB Financial Corp stock A Buy?
Several short-term signals, along with a general good trend, are positive and the stock has broken the rising trend up, which indicates an even stronger rate of rising. We can conclude that the current level may hold a buying opportunity as there is a fair chance for FB Financial Corp stock to perform well in the short-term period. Due to a possible false trend-break listing stock as pure buy candidate is held back.
Current score: 3.159 Buy Candidate Unchanged
Predicted Opening Price for FB Financial Corp of Monday, May 13, 2024
| Fair opening price May 13, 2024 | Current price |
|---|---|
| $38.79 ( 0.107%) | $38.83 |
The predicted opening price is based on yesterday's movements between high, low, and closing price.
Trading levels for FBK
Fibonacci Support & Resistance Levels
| Level | Price | |||
|---|---|---|---|---|
| Resistance | R3 | 39.49 | 1.71 % | |
| R2 | 39.22 | 1.01 % | ||
| R1 | 39.06 | 0.586 % | ||
| Current price: | 38.83 | |||
| Support | S1 | 38.52 | -0.80 % | |
| S2 | 38.35 | -1.23 % | ||
| S3 | 38.08 | -1.92 % |
Accumulated Volume Support & Resistance Levels
| Level | Price | |||
|---|---|---|---|---|
| Resistance | R3 | 0 | . | |
| R2 | 0 | . | ||
| R1 | 0 | . | ||
| Current price | 38.83 | |||
| Support | S1 | 37.65 | -3.04% | |
| S2 | 36.15 | -6.90% | ||
| S3 | 35.64 | -8.22% |
FBK Dividend Payout History
| # | Ex-Date | Pay Date | Amount | Yield | |
|---|---|---|---|---|---|
| 1 | May 13, 2024 | May 13, 2024 | May 28, 2024 | $0.170 | 0.438% |
| 2 | Feb 12, 2024 | Feb 12, 2024 | Feb 12, 2024 | $0 | 0% |
| 3 | Oct 27, 2023 | Nov 06, 2023 | Nov 21, 2023 | $0.150 | 0.452% |
| 4 | Aug 02, 2023 | Aug 11, 2023 | Sep 05, 2023 | $0.150 | 0.502% |
| 5 | Apr 28, 2023 | May 08, 2023 | May 23, 2023 | $0.150 | 0.520% |
FAQ
Click here for our free guide on how to buy FB Financial Corp Stock.