Buy Signal
Double Bottoms Short-Term
(Updated 2 days ago)
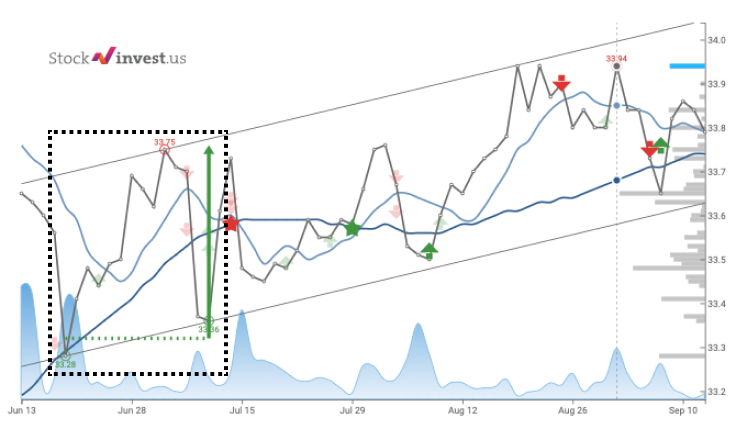
A Double Bottoms pattern in trading is a bullish reversal pattern that forms after a downtrend. It consists of two distinct lows at roughly the same price level, separated by a peak. In this list, we are taking into consideration a short period, ranging up to 3 months.
#1
Very Low Risk
2026-07-01
2.90
$75.52
0.0530%
#2
Very Low Risk
2026-07-01
1.78
$75.48
0.0530%
#3
Very Low Risk
2026-07-01
1.67
$51.77
0.0790%
#4
Very Low Risk
2026-07-01
0.96
$50.43
0.0180%
#5
Medium Risk
2026-07-01
0.92
$14.31
0.0700%
#6
Very Low Risk
2026-07-01
-0.58
$22.83
0.0440%
#7
Very Low Risk
2026-07-01
-0.67
$22.32
0.112%
#8
Very Low Risk
2026-07-01
-0.67
$41.04
0.342%
#9
Very Low Risk
2026-07-01
-0.73
$60.03
1.11%
#10
Medium Risk
2026-07-01
-2.08
$46.29
4.42%
#11
Very Low Risk
2026-07-01
-2.34
$20.23
0.198%
#12
Very Low Risk
2026-07-01
-2.50
$20.71 0%
#13
Very Low Risk
2026-07-01
-2.61
$52.25
0.153%
#14
Very Low Risk
2026-07-01
-2.63
$50.23
0.140%
#15
Medium Risk
2026-07-01
-2.76
$8.23
2.36%
#16
Medium Risk
2026-06-30
1.40
$7.28
5.66%
#17
Medium Risk
2026-06-30
0.92
$82.40
5.94%
#18
Low Risk
2026-06-30
0.73
$557.80
3.76%
#19
Very Low Risk
2026-06-30
0.00
$83.33
2.20%
#20
Very Low Risk
2026-06-30
-1.00
$59.78
0.0600%
#21
Medium Risk
2026-06-30
-2.95
$547.21
1.48%
#22
Very Low Risk
2026-06-29
0.36
$49.89
0.0600%
#23
Very Low Risk
2026-06-29
-0.67
$22.54
-0.0430%
#24
Medium Risk
2026-06-29
-1.32
$29.44
2.90%
#25
High Risk
2026-06-29
-1.56
$150.81
-3.18%
Enhance Your trading strategy with
Custom Stock Screeners. Build Yours now!
Trusted Broker
Start Your Journey With:

0% Commission Stock Trading
Follow Other Investors Strategy
Wide variety: Crypto, stocks, ETFs