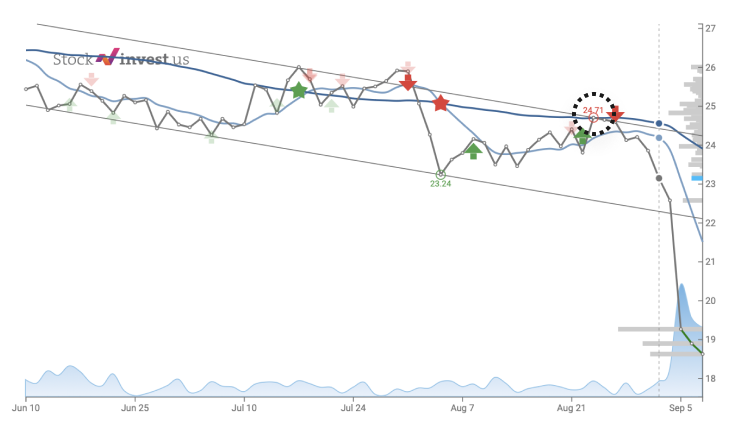
Sell Signal
Pivot Tops
(Updated 2 days ago)
A Pivot Top is the opposite of a Pivot Bottom, representing a significant high point before a potential downward trend. It is identified by algorithms developed by StockInvest.us and marked as red circles on the price line.
#1
Very High Risk
2026-07-01
-4.40
$1.65
-10.81%
#2
Medium Risk
2026-07-01
-1.78
$19.64
-3.11%
#3
Medium Risk
2026-07-01
-1.43
$21.14
-2.22%
#4
Medium Risk
2026-07-01
-1.39
$28.60
-5.27%
#5
Very Low Risk
2026-07-01
-0.97
$19.75
-0.253%
#6
Very Low Risk
2026-07-01
-0.67
$20.70
-0.145%
#7
Very Low Risk
2026-07-01
-0.57
$16.19
-0.553%
#8
Medium Risk
2026-07-01
-0.33
$63.89
-1.01%
#9
High Risk
2026-07-01
-0.22
$3.87
-0.514%
#10
Medium Risk
2026-07-01
0.08
$37.57
-0.530%
#11
Very High Risk
2026-07-01
0.19
$76.42
-2.96%
#12
Medium Risk
2026-07-01
0.22
$36.45
-0.654%
#13
Very Low Risk
2026-07-01
0.24
$12.08
-0.165%
#14
Very Low Risk
2026-07-01
0.25
$13.25
-0.0750%
#15
Medium Risk
2026-07-01
0.28
$5.87
-1.51%
#16
Medium Risk
2026-07-01
0.33
$88.72
-1.08%
#17
High Risk
2026-07-01
0.38
$18.28
-4.44%
#18
Medium Risk
2026-07-01
0.41
$19.55
-2.25%
#19
Medium Risk
2026-07-01
0.41
$18.30
-2.40%
#20
Very High Risk
2026-07-01
0.47
$7.63
-3.30%
#21
Very Low Risk
2026-07-01
0.50
$7.13
-0.140%
#22
High Risk
2026-07-01
0.54
$18.82
-4.03%
#23
Medium Risk
2026-07-01
0.58
$97.90
-1.05%
#24
High Risk
2026-07-01
0.60
$21.17
-5.74%
#25
Medium Risk
2026-07-01
0.64
$21.69
-1.25%
Enhance Your trading strategy with
Custom Stock Screeners. Build Yours now!
Trusted Broker
Start Your Journey With:

0% Commission Stock Trading
Follow Other Investors Strategy
Wide variety: Crypto, stocks, ETFs