Sell Signal
Double Tops Long-Term
(Updated 4 hours ago)
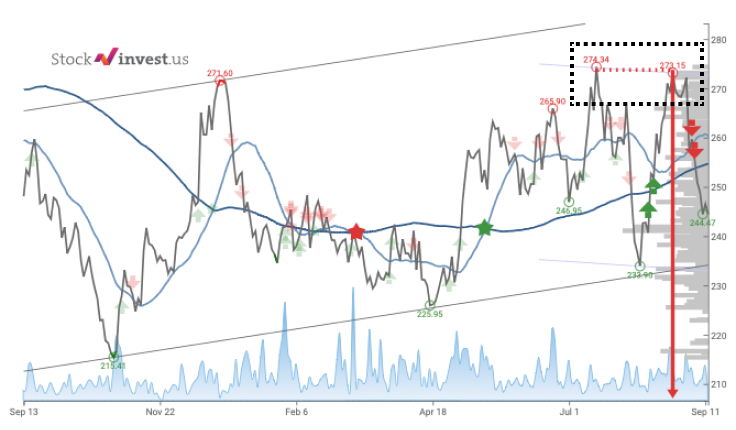
A double tops pattern in trading is a bearish reversal pattern that forms after an uptrend. It consists of two distinct highs at roughly the same price level, separated by a trough, indicating a strong resistance level and potential downward trend. However, there is a slight disagreement about how and where it should be drawn. The length of the red arrow represents the potential fall from the date issued in the signal. Nonetheless, there is a possibility it may perform better or may not perform at all. In this list, we are taking into consideration a long-term period, usually ranging up to 12 months.
#11
Very Low Risk
4.13
$9.69
0.83%
#12
Medium Risk
1.40
$544.46
0.772%
#13
Very Low Risk
-1.07
$9.20
0.327%
#14
Very Low Risk
1.68
$98.48
0.306%
#15
Very Low Risk
0.90
$13.49
0.223%
#16
Very Low Risk
0.10
$226.36
0.0710%
#17
Very Low Risk
2026-05-01
1.35
$75.67
0.0130%
#18
Very Low Risk
2026-02-02
1.84
$75.70
0.0130%
#19
Very Low Risk
1.58
$9.42 0%
#20
Medium Risk
1.74
$79.48
-0.188%
#21
Medium Risk
-0.93
$18.67
-0.427%
#22
Very Low Risk
2.99
$78.20
-0.585%
#23
Low Risk
3.46
$2,156.23
-0.721%
#24
Very Low Risk
-1.63
$110.05
-1.11%
#25
Medium Risk
0.19
$186.67
-1.48%
Enhance Your trading strategy with
Custom Stock Screeners. Build Yours now!
Trusted Broker
Start Your Journey With:

0% Commission Stock Trading
Follow Other Investors Strategy
Wide variety: Crypto, stocks, ETFs