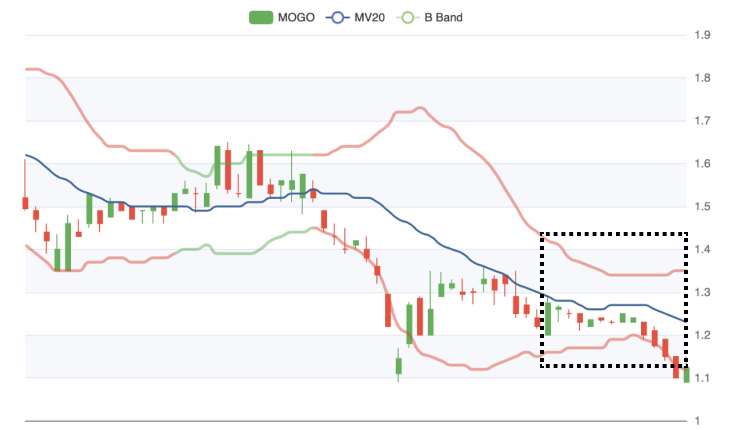
Sell Signal
Bollinger Breakout Down
(Updated 9 hours ago)
This list highlights breakout signals from Bollinger Bands bottleneck formations, indicating potential downward movements. Bollinger Bands are a widely used tool for identifying overbought and oversold conditions, and analyzing these breakouts can enhance your trading strategy.
#11
Medium Risk
2026-07-20
-2.41
$221.64
-3.63%
#12
Very Low Risk
2026-07-20
-3.63
$17.66
-0.84%
#13
Very Low Risk
2026-07-20
-2.44
$73.74
-0.365%
#14
Medium Risk
2026-07-20
-0.34
$194.60
-2.51%
#15
Medium Risk
2026-07-20
-1.12
$28.82
-2.34%
#16
Medium Risk
2026-07-20
-5.53
$8.57
-2.06%
#17
Medium Risk
2026-07-20
-3.11
$48.61
-9.09%
#18
Very Low Risk
2026-07-20
-2.13
$82.26
-0.787%
#19
Medium Risk
2026-07-20
-3.87
$25.05
-2.03%
#20
Medium Risk
2026-07-20
-3.52
$70.30
-3.34%
#21
Medium Risk
2026-07-20
-6.98
$11.44
-3.46%
#22
Low Risk
2026-07-20
-3.45
$58.91
-5.85%
#23
Low Risk
2026-07-20
-4.61
$11.91
-1.81%
#24
Medium Risk
2026-07-20
-3.10
$23.97
-9.34%
#25
Medium Risk
2026-07-20
-6.62
$4.00
-8.68%
Enhance Your trading strategy with
Custom Stock Screeners. Build Yours now!
Trusted Broker
Start Your Journey With:

0% Commission Stock Trading
Follow Other Investors Strategy
Wide variety: Crypto, stocks, ETFs