Sell Signal
RSI 21 (Overbought, Medium-Term)
(Updated 8 hours ago)
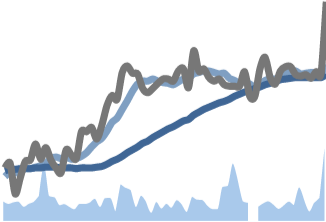
Stocks overbought according to the Relative Strength Index (RSI) momentum indicator signal an increased risk of a downward reaction, especially when a top is identified in both the RSI chart and the stock price. In the chart, the price line is marked in red when a stock triggers an overbought signal from the RSI.
#1
Very High Risk
99.00
0.00
$3.23
10,319.36%
#2
Very High Risk
81.00
0.00
$6.02
70.06%
#3
Very High Risk
79.00
0.00
$4.50
67.91%
#4
Very High Risk
89.00
0.00
$6.20
59.38%
#5
Very High Risk
82.00
0.00
$5.59
32.78%
#6
Very High Risk
78.00
0.00
$13.33
31.33%
#7
Very High Risk
81.00
0.00
$0.350
27.27%
#8
Very High Risk
78.00
0.00
$3.78
26.90%
#9
Very High Risk
79.00
0.00
$1.34
24.06%
#10
Medium Risk
78.00
0.00
$31.96
23.07%
#11
High Risk
78.00
0.00
$14.03
20.74%
#12
Very High Risk
89.00
8.34
$3.14
20.31%
#13
Very High Risk
84.00
0.00
$2.84
18.83%
#14
High Risk
71.00
0.00
$1.51
17.97%
#15
Very High Risk
78.00
0.00
$0.87
17.90%
#16
Low Risk
79.00
0.00
$17.38
16.80%
#17
Medium Risk
78.00
0.00
$53.00
15.97%
#18
Very High Risk
81.00
0.00
$1.44
15.20%
#19
Very High Risk
74.00
4.23
$3.09
11.55%
#20
High Risk
72.00
0.00
$25.67
11.27%
#21
Very High Risk
71.00
0.00
$51.58
10.91%
#22
Very High Risk
72.00
4.46
$24.40
10.56%
#23
High Risk
79.00
0.00
$44.98
10.41%
#24
Very High Risk
88.00
3.93
$3.10
10.32%
#25
Very High Risk
71.00
0.00
$8.92
9.31%
Enhance Your trading strategy with
Custom Stock Screeners. Build Yours now!
Invest Like a Pro
Access Worldwide Trading Products - 150 Markets
Compare IBKR's Margin Rates with Your Broker's
Superior Trading Technology - All Levels
High Interest Paid on Available Cash Balances
PortfolioAnalyst - All Your Accounts, One Screen
Member SIPC.