Sell Signal
Double Tops Short-Term
(Updated 29 minutes ago)
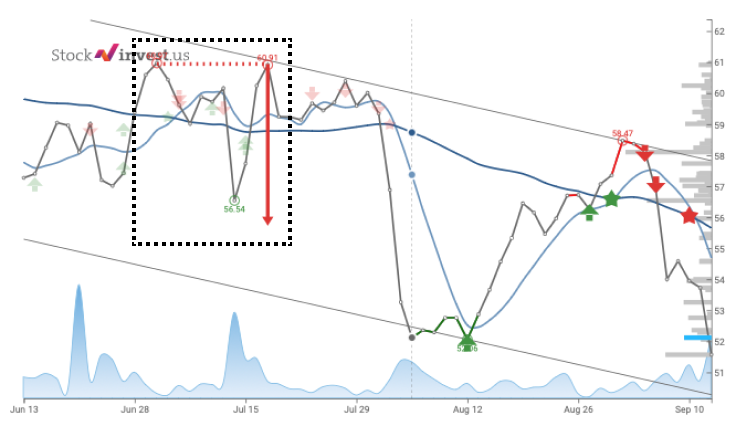
A Double Tops pattern in trading is a bearish reversal pattern that forms after an uptrend. It consists of two distinct highs at roughly the same price level, separated by a trough, indicating a strong resistance level and potential downward trend. In this list, we are taking into consideration a short period, ranging up to 3 months.
#11
Medium Risk
2026-07-16
2.31
$43.23
-1.62%
#12
Medium Risk
2026-07-16
2.74
$12.75
-0.0780%
#13
Medium Risk
2026-07-16
3.13
$11.97
-0.167%
#14
Low Risk
2026-07-16
3.26
$48.91
-1.61%
#15
Very Low Risk
2026-07-16
3.72
$41.58
-0.740%
#16
Medium Risk
2026-07-16
5.21
$16.99
-1.74%
#17
Very Low Risk
2026-07-15
-3.23
$20.30
-0.442%
#18
Very Low Risk
2026-07-15
-1.52
$49.77
-0.0270%
#19
Very Low Risk
2026-07-15
-0.93
$51.87
0.0100%
#20
Very Low Risk
2026-07-15
-0.58
$23.71
-0.294%
#21
Very Low Risk
2026-07-15
-0.49
$101.24
-1.32%
#22
Very Low Risk
2026-07-15
-0.15
$162.69
-0.227%
#23
Medium Risk
2026-07-15
0.00
$42.97
-1.76%
#24
Very Low Risk
2026-07-15
0.64
$100.23
-0.654%
#25
Very Low Risk
2026-07-15
1.21
$79.62
-0.163%
Enhance Your trading strategy with
Custom Stock Screeners. Build Yours now!
Trusted Broker
Start Your Journey With:

0% Commission Stock Trading
Follow Other Investors Strategy
Wide variety: Crypto, stocks, ETFs