Technically Overvalued (Potential Losers)
(Updated 9 hours ago)
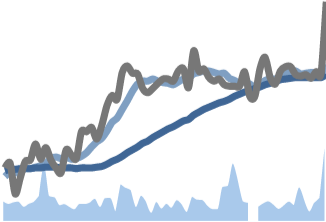
Trends are very strong indicators, and stocks usually remain within their trend for a long time. The stocks on this list are at the upper part, close to the trend roof, which usually indicates a short-term reaction down toward the middle or bottom of the trend, representing a potential sell opportunity.
#11
Medium Risk
5.11
$6.75
7.14%
#12
Low Risk
5.05
$19.31
1.58%
#13
Very Low Risk
4.98
$8.76
1.86%
#14
Medium Risk
4.87
$31.85
3.92%
#15
Medium Risk
4.85
$42.51
0.85%
#16
Low Risk
4.81
$39.86
-0.325%
#17
Very Low Risk
4.75
$16.70
0.330%
#18
Medium Risk
4.75
$22.46
1.22%
#19
Low Risk
4.71
$78.17
0.398%
#20
Medium Risk
4.69
$25.86
-0.0770%
#21
Medium Risk
4.67
$30.42
0.429%
#22
Very Low Risk
4.66
$17.54
3.06%
#23
Medium Risk
4.60
$42.82
1.28%
#24
High Risk
4.51
$148.41
-0.629%
#25
High Risk
4.50
$21.90
-0.0460%
Enhance Your trading strategy with
Custom Stock Screeners. Build Yours now!
Trusted Broker
Start Your Journey With:

0% Commission Stock Trading
Follow Other Investors Strategy
Wide variety: Crypto, stocks, ETFs