Buy Signal
Double Bottoms Long-Term
(Updated 9 hours ago)
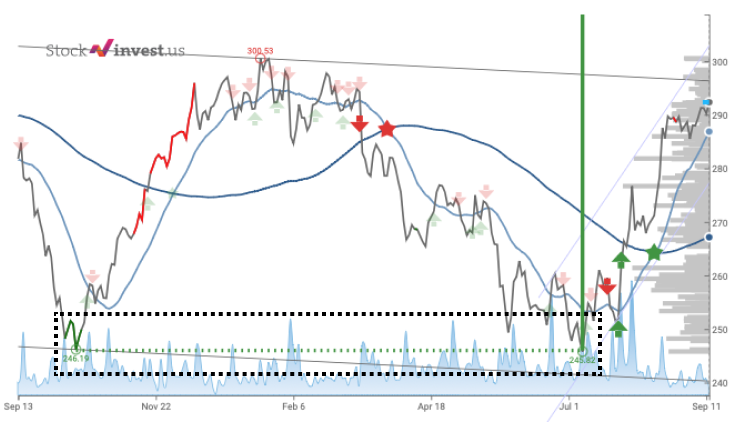
A "Double Bottoms" pattern in trading is a bullish reversal pattern that forms after a downtrend. It consists of two distinct lows at roughly the same price level, separated by a peak. In this list, we are taking into consideration a long period, usually ranging up to 12 months. This pattern indicates that the price has found a strong support level and may reverse to start an upward trend. However, there is a slight disagreement about how and where it should be drawn. The length of the green arrow represents the potential found in the signal. Nonetheless, there is a possibility it may perform better or may not perform at all.
#11
High Risk
2026-06-05
1.23
$10.42
-2.89%
#12
Very Low Risk
2026-05-19
-4.74
$16.27
-0.550%
#13
Low Risk
2026-05-19
-3.56
$203.14
-0.0840%
#14
Very Low Risk
2026-05-19
-3.22
$18.50
-0.431%
#15
Medium Risk
2026-05-19
-3.15
$286.16
-0.279%
#16
Medium Risk
2026-05-19
-1.71
$14.07
-2.02%
#17
Very Low Risk
2026-05-19
-1.39
$19.51
-0.281%
#18
Medium Risk
2026-05-19
0.66
$26.04
-1.40%
#19
Very Low Risk
2026-05-18
-3.94
$25.05
-0.299%
#20
Medium Risk
2026-05-15
1.05
$28.59
-3.61%
#21
Medium Risk
2026-04-23
-4.55
$26.65
-0.299%
#22
Very Low Risk
2026-03-30
-1.27
$15.46
0.130%
#23
Medium Risk
2026-03-30
0.27
$136.59
-2.13%
#24
Very Low Risk
2026-03-30
3.64
$50.17
-0.0600%
#25
High Risk
2026-03-27
-0.42
$21.93
-1.79%
Enhance Your trading strategy with
Custom Stock Screeners. Build Yours now!
Trusted Broker
Start Your Journey With:

0% Commission Stock Trading
Follow Other Investors Strategy
Wide variety: Crypto, stocks, ETFs