PG&E Corporation Stock Forecast
PG&E Corporation stock price up 1.75% on Wednesday
(Updated on May 01, 2024)
The PG&E Corporation stock price gained 1.75% on the last trading day (Wednesday, 1st May 2024), rising from $17.11 to $17.41. During the last trading day the stock fluctuated 2.25% from a day low at $17.10 to a day high of $17.49. The price has risen in 8 of the last 10 days and is up by 5.9% over the past 2 weeks. Volume has increased on the last day along with the price, which is a positive technical sign, and, in total, 1 million more shares were traded than the day before. In total, 11 million shares were bought and sold for approximately $195.73 million.
The stock lies in the upper part of a weak rising trend in the short term, and this may normally pose a very good selling opportunity for the short-term trader as reaction back towards the lower part of the trend can be expected. A break-up at the top trend line at $17.41 will firstly indicate a stronger rate of rising. Given the current short-term trend, the stock is expected to rise 2.92% during the next 3 months and, with a 90% probability hold a price between $16.59 and $17.92 at the end of this 3-month period.
Ready to grow your portfolio? Here's your beginner's guide to opening a free brokerage account.
PCG Signals & Forecast
Mostly positive signals in the chart today. The PG&E Corporation stock holds buy signals from both short and long-term Moving Averages giving a positive forecast for the stock. Also, there is a general buy signal from the relation between the two signals where the short-term average is above the long-term average. On corrections down, there will be some support from the lines at $17.12 and $16.64. A breakdown below any of these levels will issue sell signals. A buy signal was issued from a pivot bottom point on Tuesday, April 16, 2024, and so far it has risen 8.61%. Further rise is indicated until a new top pivot has been found. Furthermore, there is a buy signal from the 3 month Moving Average Convergence Divergence (MACD). Volume is rising along with the price. This is considered to be a good technical signal. The stock had a Golden Star Signal on Thursday, February 29, 2024 in the short-term chart.
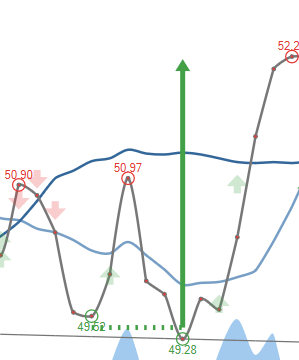
Golden Star Signal is when the short-term moving average, the long-term moving average, and price line meet in a special combination. This combination is very rare and often followed by long and strong gains for the stock in question.
Golden Star
The stock had a Golden Star Signal on Thursday, February 29, 2024 in the short-term chart.Golden Star Signal is when the short-term moving average, the long-term moving average, and price line meet in a special combination. This combination is very rare and often followed by long and strong gains for the stock in question.
 A buy signal from a double bottom formation was found on Tuesday, April 16, 2024 with a target of $17.02. Despite whether the objective of the signal formation has been reached the stock may continue to perform well.
Support, Risk & Stop-loss for PG&E Corporation stock
On the downside, the stock finds support just below today's level from accumulated volume at $16.41 and $16.25. There is a natural risk involved when a stock is testing a support level, since if this is broken, the stock then may fall to the next support level. In this case, PG&E Corporation finds support just below today's level at $16.41. If this is broken, then the next support from accumulated volume will be at $16.25 and $16.24.
In general the stock tends to have very controlled movements and with good liquidity the risk is considered very low in this stock. During the last day, the stock moved $0.385 between high and low, or 2.25%. For the last week the stock has had daily average volatility of 2.03%.
Our recommended stop-loss: $16.70 (-4.07%) (This stock has low daily movements and this gives low risk. There is a buy signal from a pivot bottom found 11 days ago.)
Trading Expectations (PCG) For The Upcoming Trading Day Of Thursday 2nd
For the upcoming trading day on Thursday, 2nd we expect PG&E Corporation to open at $17.33, and during the day (based on 14 day Average True Range), to move between $17.09 and $17.73, which gives a possible trading interval of +/-$0.320 (+/-1.84%) up or down from last closing price. If PG&E Corporation takes out the full calculated possible swing range there will be an estimated 3.67% move between the lowest and the highest trading price during the day.
With no resistance above and support from accumulated volume @ $16.41, some $1.00 (5.74%) from the current price of $17.41, our system finds the risk reward attractive.
Is PG&E Corporation stock A Buy?
Several short-term signals, along with a general good trend, are positive and we conclude that the current level may hold a buying opportunity as there is a fair chance for PG&E Corporation stock to perform well in the short-term.
Current score: 3.127 Buy Candidate Unchanged
Predicted Opening Price for PG&E Corporation of Thursday, May 2, 2024
| Fair opening price May 2, 2024 | Current price |
|---|---|
| $17.33 ( 0.450%) | $17.41 |
The predicted opening price is based on yesterday's movements between high, low, and closing price.
Trading levels for PCG
Fibonacci Support & Resistance Levels
| Level | Price | |||
|---|---|---|---|---|
| Resistance | R3 | 17.72 | 1.76 % | |
| R2 | 17.57 | 0.92 % | ||
| R1 | 17.48 | 0.395 % | ||
| Current price: | 17.41 | |||
| Support | S1 | 17.18 | -1.29 % | |
| S2 | 17.09 | -1.82 % | ||
| S3 | 16.95 | -2.66 % |
Accumulated Volume Support & Resistance Levels
| Level | Price | |||
|---|---|---|---|---|
| Resistance | R3 | 0 | . | |
| R2 | 0 | . | ||
| R1 | 0 | . | ||
| Current price | 17.41 | |||
| Support | S1 | 16.41 | -5.74% | |
| S2 | 16.25 | -6.66% | ||
| S3 | 16.24 | -6.72% |
PCG Dividend Payout History
| # | Ex-Date | Pay Date | Amount | Yield | |
|---|---|---|---|---|---|
| 1 | Mar 27, 2024 | Mar 27, 2024 | Apr 15, 2024 | $0.0100 | 0.0614% |
| 2 | Nov 28, 2023 | Dec 28, 2023 | Jan 15, 2024 | $0.0100 | 0.0571% |
| 3 | Sep 20, 2017 | Sep 28, 2017 | Oct 15, 2017 | $0.530 | 0.92% |
| 4 | May 31, 2017 | Jun 28, 2017 | Jul 15, 2017 | $0.530 | 0.799% |
| 5 | Mar 14, 2017 | Mar 29, 2017 | Apr 15, 2017 | $0.490 | 0.730% |
FAQ
Click here for our free guide on how to buy PG&E Corporation Stock.