LEC,INC. Stock Forecast
LEC,INC. stock price up more than 5.44% on Friday
(Updated on May 10, 2024)
The LEC,INC. stock price gained 5.44% on the last trading day (Friday, 10th May 2024), rising from JP¥1,103.00 to JP¥1,163.00. During the last trading day the stock fluctuated 4.20% from a day low at JP¥1,120.00 to a day high of JP¥1,167.00. The price has risen in 5 of the last 10 days and is up by 5.82% over the past 2 weeks. Volume has increased on the last day along with the price, which is a positive technical sign, and, in total, 152 thousand more shares were traded than the day before. In total, 192 thousand shares were bought and sold for approximately JP¥223.53 million.
The stock lies in the middle of a wide and weak rising trend in the short term and a further rise within the trend is signaled. Given the current short-term trend, the stock is expected to rise 2.05% during the next 3 months and, with a 90% probability hold a price between JP¥1,105.59 and JP¥1,226.79 at the end of this 3-month period.
Ready to grow your portfolio? Here's your beginner's guide to opening a free brokerage account.
7874.T Signals & Forecast
The LEC,INC. stock holds buy signals from both short and long-term Moving Averages giving a positive forecast for the stock, but the stock has a general sell signal from the relation between the two signals where the long-term average is above the short-term average. On corrections down, there will be some support from the lines at JP¥1,109.86 and JP¥1,127.83. A breakdown below any of these levels will issue sell signals. A buy signal was issued from a pivot bottom point on Thursday, April 25, 2024, and so far it has risen 7.69%. Further rise is indicated until a new top pivot has been found. Volume is rising along with the price. This is considered to be a good technical signal. Some negative signals were issued as well, and these may have some influence on the near short-term development. Furthermore, there is currently a sell signal from the 3 month Moving Average Convergence Divergence (MACD). The stock had a Golden Star Signal on Thursday, July 27, 2023 in the long-term chart.
Golden Star Signal is when the short-term moving average, the long-term moving average, and price line meet in a special combination. This combination is very rare and often followed by long and strong gains for the stock in question.
Golden Star 12 Months
The stock had a Golden Star Signal on Thursday, July 27, 2023 in the long-term chart.Golden Star Signal is when the short-term moving average, the long-term moving average, and price line meet in a special combination. This combination is very rare and often followed by long and strong gains for the stock in question.
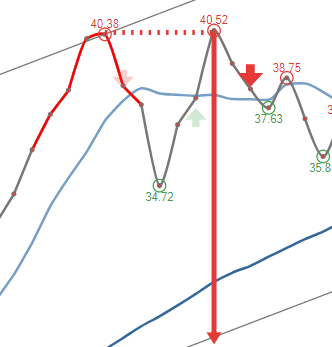 A sell signal from a double top formation was found on Monday, April 01, 2024 and based on theory for this formation the price should fall by -6.05% to JP¥1,092.67 within 3 trading days since signal was issued (Monday, May 13, 2024).
Support, Risk & Stop-loss for LEC,INC. stock
LEC,INC. finds support from accumulated volume at JP¥1,144.00 and this level may hold a buying opportunity as an upwards reaction can be expected when the support is being tested.
This stock is usually traded at a good volume, and with minor daily changes, the risk is considered to be low. During the last day, the stock moved JP¥47.00 (4.20%) between high and low. For the last week, the stock has had daily average volatility of 1.94%.
Our recommended stop-loss: JP¥1,115.60 (-4.08%) (This stock has low daily movements and this gives low risk. There is a buy signal from a pivot bottom found 8 days ago.)
Trading Expectations (7874.T) For The Upcoming Trading Day Of Monday 13th
For the upcoming trading day on Monday, 13th we expect LEC,INC. to open at JP¥1,150.00, and during the day (based on 14 day Average True Range), to move between JP¥1,136.46 and JP¥1,189.54, which gives a possible trading interval of +/-JP¥26.54 (+/-2.28%) up or down from last closing price. If LEC,INC. takes out the full calculated possible swing range there will be an estimated 4.56% move between the lowest and the highest trading price during the day.
Since the stock is closer to the support from accumulated volume at JP¥1,144.00 (1.63%) than the resistance at JP¥1,188.00 (2.15%), our systems sees the trading risk/reward intra-day as attractive and believe profit can be made before the stock reaches first resistance..
Is LEC,INC. stock A Buy?
LEC,INC. holds several positive signals, but we still don't find these to be enough for a buy candidate. At the current level, it should be considered as a hold candidate (hold or accumulate) in this position whilst awaiting further development.
Current score: 0.810 Hold/Accumulate Unchanged
Predicted Opening Price for LEC,INC. of Monday, May 13, 2024
| Fair opening price May 13, 2024 | Current price |
|---|---|
| JP¥1,150.00 ( 1.12%) | JP¥1,163.00 |
The predicted opening price is based on yesterday's movements between high, low, and closing price.
Trading levels for 7874.T
Fibonacci Support & Resistance Levels
| Level | Price | |||
|---|---|---|---|---|
| Resistance | R3 | 1,197.00 | 2.92 % | |
| R2 | 1,179.05 | 1.38 % | ||
| R1 | 1,167.95 | 0.426 % | ||
| Current price: | 1,163.00 | |||
| Support | S1 | 1,132.05 | -2.66 % | |
| S2 | 1,120.95 | -3.62 % | ||
| S3 | 1,103.00 | -5.16 % |
Accumulated Volume Support & Resistance Levels
| Level | Price | |||
|---|---|---|---|---|
| Resistance | R3 | 0 | . | |
| R2 | 1,190.00 | 2.32 % | ||
| R1 | 1,188.00 | 2.15 % | ||
| Current price | 1,163.00 | |||
| Support | S1 | 1,144.00 | -1.63% | |
| S2 | 1,100.00 | -5.42% | ||
| S3 | 1,099.00 | -5.50% |
7874 Dividend Payout History
| # | Ex-Date | Pay Date | Amount | Yield | |
|---|---|---|---|---|---|
| 1 | Mar 28, 2024 | Mar 28, 2024 | Mar 28, 2024 | JP¥0 | 0% |
| 2 | Sep 28, 2023 | Sep 28, 2023 | Sep 28, 2023 | JP¥10.00 | 1.05% |
| 3 | Mar 30, 2023 | Mar 30, 2023 | Mar 30, 2023 | JP¥10.00 | 1.27% |
| 4 | Sep 29, 2022 | Sep 29, 2022 | Sep 29, 2022 | JP¥10.00 | 1.20% |
| 5 | Mar 30, 2022 | Mar 30, 2022 | Mar 30, 2022 | JP¥13.00 | 1.45% |
FAQ
Click here for our free guide on how to buy LEC,INC. Stock.