Cerillion Plc Stock Forecast
Cerillion Plc stock downgraded to Hold/Accumulate
(Updated on May 09, 2024)
No changes to the price of Cerillion Plc stock on the last trading day (Thursday, 9th May 2024). During the last trading day the stock fluctuated 0% from a day low at £1,620.00 to a day high of £1,620.00. The price has risen in 5 of the last 10 days and is up by 4.52% over the past 2 weeks.
The stockis at the upper part of a wide and horizontal trend and normally this may pose a good selling opportunity but a break-up through the top trend line at £1,620.09 will give a strong buy signal and a trend shift could be expected. Given the current horizontal trend, you can expect Cerillion Plc stock with a 90% probability to be traded between £1,462.08 and £1,621.87 at the end of this 3-month period. A break of a horizontal trend is often followed by a large increase in the volume, and stocks seldom manage to go directly from the bottom of a trend up to the top. Stocks turning up in the middle of a horizontal trend are therefore considered to be potential runners.
Ready to grow your portfolio? Here's your beginner's guide to opening a free brokerage account.
CER.L Signals & Forecast
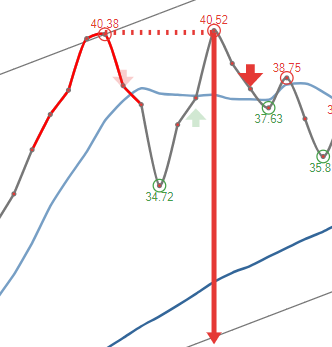
The Cerillion Plc stock holds buy signals from both short and long-term Moving Averages giving a positive forecast for the stock. Also, there is a general buy signal from the relation between the two signals where the short-term average is above the long-term average. On corrections down, there will be some support from the lines at £1,597.14 and £1,538.57. A breakdown below any of these levels will issue sell signals. Furthermore, there is a buy signal from the 3 month Moving Average Convergence Divergence (MACD). Some negative signals were issued as well, and these may have some influence on the near short-term development. A sell signal was issued from a pivot top point on Wednesday, May 08, 2024, and so far it has fallen 0%. Further fall is indicated until a new bottom pivot has been found. Volume fell on the last day without any changes to the price. This does not cause any direct divergence but may be an early warning and a possible "turning point". The very low volume increases the risk and reduces the other technical signals issued. The stock had a Golden Star Signal on Tuesday, April 02, 2024 in the short-term chart.
Golden Star Signal is when the short-term moving average, the long-term moving average, and price line meet in a special combination. This combination is very rare and often followed by long and strong gains for the stock in question.
Golden Star
The stock had a Golden Star Signal on Tuesday, April 02, 2024 in the short-term chart.Golden Star Signal is when the short-term moving average, the long-term moving average, and price line meet in a special combination. This combination is very rare and often followed by long and strong gains for the stock in question.
Support, Risk & Stop-loss for Cerillion Plc stock
Cerillion Plc finds support from accumulated volume at £1,590.00 and this level may hold a buying opportunity as an upwards reaction can be expected when the support is being tested.
In general the stock tends to have very controlled movements and therefore the general risk is considered very low. However, be aware of low or falling volume and make sure to keep an eye on the stock During the last day, the stock moved £0 between high and low, or 0%. For the last week the stock has had daily average volatility of 1.39%
Our recommended stop-loss: £1,562.33 (-3.56%) (This stock has low daily movements and this gives low risk. There is a sell signal from a pivot top found 1 day ago.)
Trading Expectations (CER.L) For The Upcoming Trading Day Of Friday 10th
For the upcoming trading day on Friday, 10th we expect Cerillion Plc to open at £1,620.00, and during the day (based on 14 day Average True Range), to move between £1,572.19 and £1,667.81, which gives a possible trading interval of +/-£47.81 (+/-2.95%) up or down from last closing price. If Cerillion Plc takes out the full calculated possible swing range there will be an estimated 5.90% move between the lowest and the highest trading price during the day.
With no resistance above and support from accumulated volume @ £1,590.00, some £30.00 (1.85%) from the current price of £1,620.00, our system finds the risk reward attractive.
Earnings coming up
Cerillion Plc will release earnings BMO on Monday, May 13, 2024. We will update the financials statements for Cerillion Plc, that can be found here as soon as the records are public. Our systems has calculated a possible swing of +/- 3.39% in the first trading day after earnings release.
Is Cerillion Plc stock A Buy?
Cerillion Plc holds several positive signals, but we still don't find these to be enough for a buy candidate. At the current level, it should be considered as a hold candidate (hold or accumulate) in this position whilst awaiting further development. Due to some small weaknesses in the technical picture we have downgraded our analysis conclusion for this stock since the last evaluation from a Buy to a Hold/Accumulate candidate.
Current score: 0.000 Hold/Accumulate Downgraded
Zero in score indicates that our system is expecting high volatility and risk for the following trading day. Given the latest developments, we cannot determine the next direction as it may go both ways.
Predicted Opening Price for Cerillion Plc of Friday, May 10, 2024
| Fair opening price May 10, 2024 | Current price |
|---|---|
| £1,620.00 ( 0%) | £1,620.00 |
The predicted opening price is based on yesterday's movements between high, low, and closing price.
Trading levels for CER.L
Fibonacci Support & Resistance Levels
| Level | Price | |||
|---|---|---|---|---|
| Resistance | R3 | 1,620.00 | . | |
| R2 | 1,620.00 | . | ||
| R1 | 1,620.00 | . | ||
| Current price: | 1,620.00 | |||
| Support | S1 | 1,620.00 | . | |
| S2 | 1,620.00 | . | ||
| S3 | 1,620.00 | . |
Accumulated Volume Support & Resistance Levels
| Level | Price | |||
|---|---|---|---|---|
| Resistance | R3 | 0 | . | |
| R2 | 0 | . | ||
| R1 | 0 | . | ||
| Current price | 1,620.00 | |||
| Support | S1 | 1,590.00 | -1.85% | |
| S2 | 1,570.00 | -3.09% | ||
| S3 | 1,555.00 | -4.01% |
CER Dividend Payout History
| # | Ex-Date | Pay Date | Amount | Yield | |
|---|---|---|---|---|---|
| 1 | Dec 28, 2023 | Dec 28, 2023 | Dec 28, 2023 | £0 | 0% |
| 2 | Jun 01, 2023 | Jun 01, 2023 | Jun 01, 2023 | £3.30 | 0.249% |
| 3 | Nov 28, 2022 | Dec 29, 2022 | Feb 08, 2023 | £6.50 | 0.630% |
| 4 | May 09, 2022 | May 26, 2022 | Jun 17, 2022 | £2.60 | 0.301% |
| 5 | Nov 22, 2021 | Dec 30, 2021 | Feb 08, 2022 | £5.00 | 0.676% |
FAQ
Click here for our free guide on how to buy Cerillion Plc Stock.