Harworth Group plc Stock Forecast
Harworth Group plc stock price up 1.47% on Friday
(Updated on May 03, 2024)
The Harworth Group plc stock price gained 1.47% on the last trading day (Friday, 3rd May 2024), rising from £136.50 to £138.50. During the last trading day the stock fluctuated 4.91% from a day low at £132.50 to a day high of £139.00. The price has risen in 4 of the last 10 days and is up by 7.36% over the past 2 weeks. Volume has increased on the last day along with the price, which is a positive technical sign, and, in total, 93 thousand more shares were traded than the day before. In total, 103 thousand shares were bought and sold for approximately £14.26 million.
The stock lies in the middle of a weak rising trend in the short term and a further rise within the trend is signaled. Given the current short-term trend, the stock is expected to rise 4.31% during the next 3 months and, with a 90% probability hold a price between £135.64 and £147.55 at the end of this 3-month period.
Ready to grow your portfolio? Here's your beginner's guide to opening a free brokerage account.
HWG.L Signals & Forecast
The Harworth Group plc stock holds buy signals from both short and long-term Moving Averages giving a positive forecast for the stock. Also, there is a general buy signal from the relation between the two signals where the short-term average is above the long-term average. On corrections down, there will be some support from the lines at £134.71 and £133.37. A breakdown below any of these levels will issue sell signals. Furthermore, there is a buy signal from the 3 month Moving Average Convergence Divergence (MACD). Volume is rising along with the price. This is considered to be a good technical signal. Some negative signals were issued as well, and these may have some influence on the near short-term development. A sell signal was issued from a pivot top point on Tuesday, April 30, 2024, and so far it has fallen -0.360%. Further fall is indicated until a new bottom pivot has been found. The stock had a Golden Star Signal on Wednesday, March 13, 2024 in the short-term chart.
Golden Star Signal is when the short-term moving average, the long-term moving average, and price line meet in a special combination. This combination is very rare and often followed by long and strong gains for the stock in question.
Golden Star
The stock had a Golden Star Signal on Wednesday, March 13, 2024 in the short-term chart.Golden Star Signal is when the short-term moving average, the long-term moving average, and price line meet in a special combination. This combination is very rare and often followed by long and strong gains for the stock in question.
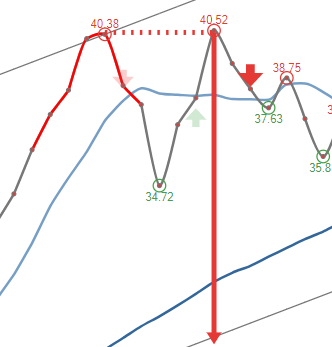 A sell signal from a double top formation was found on Tuesday, April 30, 2024 and based on theory for this formation the price should fall by -9.68% to £125.09 within 23 trading days since signal was issued (Tuesday, May 07, 2024).
Support, Risk & Stop-loss for Harworth Group plc stock
Harworth Group plc finds support from accumulated volume at £134.50 and this level may hold a buying opportunity as an upwards reaction can be expected when the support is being tested.
This stock is usually traded at a good volume, and with minor daily changes, the risk is considered to be low. During the last day, the stock moved £6.50 (4.91%) between high and low. For the last week, the stock has had daily average volatility of 4.01%.
Our recommended stop-loss: £133.21 (-3.82%) (This stock has low daily movements and this gives low risk. There is a sell signal from a pivot top found 3 days ago.)
Trading Expectations (HWG.L) For The Upcoming Trading Day Of Tuesday 7th
For the upcoming trading day on Tuesday, 7th we expect Harworth Group plc to open at £136.67, and during the day (based on 14 day Average True Range), to move between £134.35 and £142.65, which gives a possible trading interval of +/-£4.15 (+/-3.00%) up or down from last closing price. If Harworth Group plc takes out the full calculated possible swing range there will be an estimated 6.00% move between the lowest and the highest trading price during the day.
Since the stock is closer to the resistance from accumulated volume at £139.00 (0.36%) than the support at £134.50 (2.89%), our systems don't find the trading risk/reward intra-day attractive and any bets should be held until the stock is closer to the support level.
Is Harworth Group plc stock A Buy?
Several short-term signals, along with a general good trend, are positive and we conclude that the current level may hold a buying opportunity as there is a fair chance for Harworth Group plc stock to perform well in the short-term.
Current score: 2.655 Buy Candidate Unchanged
Predicted Opening Price for Harworth Group plc of Tuesday, May 7, 2024
| Fair opening price May 7, 2024 | Current price |
|---|---|
| £136.67 ( 1.32%) | £138.50 |
The predicted opening price is based on yesterday's movements between high, low, and closing price.
Trading levels for HWG.L
Fibonacci Support & Resistance Levels
| Level | Price | |||
|---|---|---|---|---|
| Resistance | R3 | 143.17 | 3.37 % | |
| R2 | 140.68 | 1.58 % | ||
| R1 | 139.15 | 0.469 % | ||
| Current price: | 138.50 | |||
| Support | S1 | 134.18 | -3.12 % | |
| S2 | 132.65 | -4.22 % | ||
| S3 | 130.17 | -6.02 % |
Accumulated Volume Support & Resistance Levels
| Level | Price | |||
|---|---|---|---|---|
| Resistance | R3 | 0 | . | |
| R2 | 0 | . | ||
| R1 | 139.00 | 0.361 % | ||
| Current price | 138.50 | |||
| Support | S1 | 134.50 | -2.89% | |
| S2 | 130.00 | -6.14% | ||
| S3 | 129.50 | -6.50% |
HWG Dividend Payout History
| # | Ex-Date | Pay Date | Amount | Yield | |
|---|---|---|---|---|---|
| 1 | Apr 25, 2024 | Apr 25, 2024 | May 24, 2024 | £1.02 | 0.738% |
| 2 | May 04, 2023 | May 04, 2023 | May 04, 2023 | £0.93 | 0.774% |
| 3 | Sep 13, 2022 | Sep 22, 2022 | Oct 21, 2022 | £0.404 | 0.358% |
| 4 | Mar 22, 2022 | May 05, 2022 | May 27, 2022 | £0.85 | 0.506% |
| 5 | Sep 14, 2021 | Sep 23, 2021 | Oct 22, 2021 | £0.367 | 0.216% |
FAQ
Click here for our free guide on how to buy Harworth Group plc Stock.