International Money Express Inc. Stock Forecast
Strong day for International Money Express Inc. stock price on Thursday rising 5.49% to $21.12
(Updated on May 09, 2024)
The International Money Express Inc. stock price gained 5.49% on the last trading day (Thursday, 9th May 2024), rising from $20.02 to $21.12. It has now gained 3 days in a row. It will be exciting to see whether it manages to continue gaining or take a minor break for the next few days. During the last trading day the stock fluctuated 5.75% from a day low at $20.16 to a day high of $21.32. The price has been going up and down for this period, and there has been a -0.33% loss for the last 2 weeks. Volume has increased on the last day along with the price, which is a positive technical sign, and, in total, 180 thousand more shares were traded than the day before. In total, 675 thousand shares were bought and sold for approximately $14.25 million.
The stock is moving within a wide and horizontal trend and further movements within this trend can be expected. Given the current horizontal trend, you can expect International Money Express Inc. stock with a 90% probability to be traded between $19.66 and $23.34 at the end of this 3-month period. A break of a horizontal trend is often followed by a large increase in the volume, and stocks seldom manage to go directly from the bottom of a trend up to the top. Stocks turning up in the middle of a horizontal trend are therefore considered to be potential runners.
Ready to grow your portfolio? Here's your beginner's guide to opening a free brokerage account.
IMXI Signals & Forecast
A buy signal was issued from a pivot bottom point on Monday, May 06, 2024, and so far it has risen 9.15%. Further rise is indicated until a new top pivot has been found. Volume is rising along with the price. This is considered to be a good technical signal. Some negative signals were issued as well, and these may have some influence on the near short-term development. The International Money Express Inc. stock holds a buy signal from the short-term Moving Average; at the same time, however, the long-term average holds a general sell signal. Since the longterm average is above the short-term average there is a general sell signal in the stock giving a more negative forecast for the stock. On further gains, the stock will meet resistance from the long-term Moving Average at $21.55. On a fall, the stock will find some support from the short-term average at $20.04. A break-up through the long-term average will give another buy signal, while a fall below the short-term average will add another sell signal and strengthen the general signal. Furthermore, there is currently a sell signal from the 3 month Moving Average Convergence Divergence (MACD). The stock had a Golden Star Signal on Wednesday, February 21, 2024 in the short-term chart.
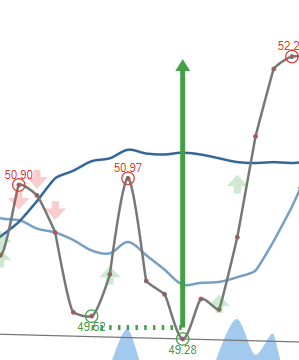
Golden Star Signal is when the short-term moving average, the long-term moving average, and price line meet in a special combination. This combination is very rare and often followed by long and strong gains for the stock in question.
Golden Star
The stock had a Golden Star Signal on Wednesday, February 21, 2024 in the short-term chart.Golden Star Signal is when the short-term moving average, the long-term moving average, and price line meet in a special combination. This combination is very rare and often followed by long and strong gains for the stock in question.
 A buy signal from a double bottom formation was found on Monday, May 06, 2024 and based on theory for this formation the price should go up by 19.07% to $25.15 within 45 trading days since signal was issued (Friday, May 10, 2024).
Support, Risk & Stop-loss for International Money Express Inc. stock
On the downside, the stock finds support just below today's level from accumulated volume at $20.02 and $19.91. There is a natural risk involved when a stock is testing a support level, since if this is broken, the stock then may fall to the next support level. In this case, International Money Express Inc. finds support just below today's level at $20.02. If this is broken, then the next support from accumulated volume will be at $19.91 and $19.59.
This stock has average movements during the day and with good trading volume, the risk is considered to be medium. During the last day, the stock moved $1.16 between high and low, or 5.75%. For the last week, the stock has had daily average volatility of 5.17%.
Our recommended stop-loss: We hold a negative evaluation for this stock. No stop-loss is set.
Trading Expectations (IMXI) For The Upcoming Trading Day Of Friday 10th
For the upcoming trading day on Friday, 10th we expect International Money Express Inc. to open at $20.87, and during the day (based on 14 day Average True Range), to move between $20.38 and $21.86, which gives a possible trading interval of +/-$0.744 (+/-3.52%) up or down from last closing price. If International Money Express Inc. takes out the full calculated possible swing range there will be an estimated 7.05% move between the lowest and the highest trading price during the day.
Since the stock is closer to the resistance from accumulated volume at $21.36 (1.14%) than the support at $20.02 (5.21%), our systems don't find the trading risk/reward intra-day attractive and any bets should be held until the stock is closer to the support level.
Is International Money Express Inc. stock A Buy?
International Money Express Inc. holds several negative signals and we believe that it will still perform weakly in the next couple of days or weeks. We, therefore, hold a negative evaluation of this stock.
Current score: -1.471 Sell Candidate Unchanged
Predicted Opening Price for International Money Express Inc. of Friday, May 10, 2024
| Fair opening price May 10, 2024 | Current price |
|---|---|
| $20.87 ( 1.20%) | $21.12 |
The predicted opening price is based on yesterday's movements between high, low, and closing price.
Trading levels for IMXI
Fibonacci Support & Resistance Levels
| Level | Price | |||
|---|---|---|---|---|
| Resistance | R3 | 22.03 | 4.29 % | |
| R2 | 21.58 | 2.19 % | ||
| R1 | 21.31 | 0.90 % | ||
| Current price: | 21.12 | |||
| Support | S1 | 20.42 | -3.30 % | |
| S2 | 20.15 | -4.59 % | ||
| S3 | 19.71 | -6.69 % |
Accumulated Volume Support & Resistance Levels
| Level | Price | |||
|---|---|---|---|---|
| Resistance | R3 | 22.58 | 6.91 % | |
| R2 | 21.50 | 1.80 % | ||
| R1 | 21.36 | 1.14 % | ||
| Current price | 21.12 | |||
| Support | S1 | 20.02 | -5.21% | |
| S2 | 19.91 | -5.73% | ||
| S3 | 19.59 | -7.24% |
FAQ
Click here for our free guide on how to buy International Money Express Inc. Stock.