InCapta, Inc. Stock Forecast
High volatility in InCapta, Inc. stock price on Thursday which ended trading at $0.0001
(Updated on Apr 25, 2024)
The InCapta, Inc. stock price gained 9,900.00% on the last trading day (Thursday, 25th Apr 2024), rising from $0.000001 to $0.0001. During the last trading day the stock fluctuated 100.00% from a day low at $0.00005 to a day high of $0.0001. The price has risen in 4 of the last 10 days and is up by 9900% over the past 2 weeks. Volume has increased on the last day along with the price, which is a positive technical sign, and, in total, 144 million more shares were traded than the day before. In total, 146 million shares were bought and sold for approximately $14.65 thousand.
The stockhas broken the very wide and falling short-term trend up. Firstly a slower falling rate is indicated, but this may very well be an early signal of a trend shift. On the reaction, there will be support on the roof of the current trend broken, which is $0.00009679, a level that may pose a second chance to hit a runner. According to fan-theory $0.0002 will be the next possible trend-top level and thereby pose a resistance level that may not be broken at the first attempt. Due to the high volatility and the trend direction we are not able to give forecast range for this stock. Do note, that if the stock price manages to stay at current levels or higher, our prediction target will start to change positively over the next few days as the conditions for the current predictions will be broken.
Ready to grow your portfolio? Here's your beginner's guide to opening a free brokerage account.
INCT Signals & Forecast
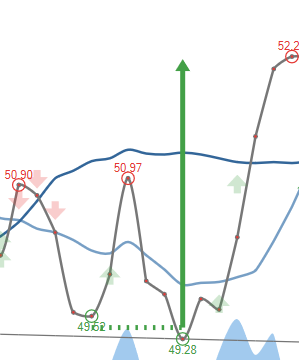
Mostly positive signals in the chart today. The InCapta, Inc. stock holds buy signals from both short and long-term Moving Averages giving a positive forecast for the stock, but the stock has a general sell signal from the relation between the two signals where the long-term average is above the short-term average. On corrections down, there will be some support from the lines at $0.00002214 and $0.0000448. A breakdown below any of these levels will issue sell signals. A buy signal was issued from a pivot bottom point on Friday, April 19, 2024, and so far it has risen 9,900.00%. Further rise is indicated until a new top pivot has been found. Furthermore, there is a buy signal from the 3 month Moving Average Convergence Divergence (MACD). InCapta, Inc. has increased volume and follows the last lift in the price. This is considered to be a technical positive sign as volume should follow the price-formation. The very low volume increases the risk and reduces the other technical signals issued.
 A buy signal from a double bottom formation was found on Friday, April 19, 2024 with a target of $0.000099. Despite whether the objective of the signal formation has been reached the stock may continue to perform well.
Support, Risk & Stop-loss for InCapta, Inc. stock
There is no support from accumulated volume below today's level and given the right condition the stock may perform very badly in the next couple of days.
This stock may move very much during the day (volatility) and with a very large prediction interval from the Bollinger Band this stock is considered to be "very high risk". During the last day, the stock moved $0.00005 between high and low, or 100.00%. For the last week, the stock has had daily average volatility of 7,940.00%.
Our recommended stop-loss: $0.00009612 (-3.88%) (This stock has very high daily movements and this gives very high risk. There is a buy signal from a pivot bottom found 4 days ago.)
Trading Expectations (INCT) For The Upcoming Trading Day Of Friday 26th
For the upcoming trading day on Friday, 26th we expect InCapta, Inc. to open at $0.00008333, and during the day (based on 14 day Average True Range), to move between $0.00000921 and $0.0002, which gives a possible trading interval of +/-$0.00009079 (+/-90.79%) up or down from last closing price. If InCapta, Inc. takes out the full calculated possible swing range there will be an estimated 181.58% move between the lowest and the highest trading price during the day.
Is InCapta, Inc. stock A Buy?
InCapta, Inc. holds several positive signals and the break up from the falling trend indicates a possible shift of trend as well. The trend doesn't have to go from falling to rising, it may as well go horizontal or even just decrease the earlier fall rate, but we find the risk-reward to be attractive and expect the stock to perform very well in the short term period. We have upgraded our analysis conclusion for this stock since the last evaluation from a Strong Sell to a Strong Buy candidate.
Current score: 5.124 Strong Buy Candidate Upgraded
Predicted Opening Price for InCapta, Inc. of Friday, April 26, 2024
| Fair opening price April 26, 2024 | Current price |
|---|---|
| $0.00008333 ( 16.67%) | $0.0001 |
The predicted opening price is based on yesterday's movements between high, low, and closing price.
Trading levels for INCT
Fibonacci Support & Resistance Levels
| Level | Price | |||
|---|---|---|---|---|
| Resistance | R3 | 0.0001 | 33.33 % | |
| R2 | 0.0001 | 14.23 % | ||
| R1 | 0.0001 | 2.43 % | ||
| Current price: | 0.0001 | |||
| Support | S1 | 0.00006423 | -35.77 % | |
| S2 | 0.00005243 | -47.57 % | ||
| S3 | 0.00003333 | -66.67 % |
Accumulated Volume Support & Resistance Levels
| Level | Price | |||
|---|---|---|---|---|
| Resistance | R3 | 0 | . | |
| R2 | 0 | . | ||
| R1 | 0 | . | ||
| Current price | 0.0001 | |||
| Support | S1 | 0 | . | |
| S2 | 0 | . | ||
| S3 | 0 | . |
FAQ
Click here for our free guide on how to buy InCapta, Inc. Stock.