JB Hi-Fi Limited Stock Forecast
Green day on Friday for JB Hi-Fi Limited stock after gaining 0.684%
(Updated on May 03, 2024)
The JB Hi-Fi Limited stock price gained 0.684% on the last trading day (Friday, 3rd May 2024), rising from $59.93 to $60.34. During the last trading day the stock fluctuated 1.49% from a day low at $59.89 to a day high of $60.78. The price has been going up and down for this period, and there has been a -2.46% loss for the last 2 weeks. Volume has increased on the last day along with the price, which is a positive technical sign, and, in total, 24 thousand more shares were traded than the day before. In total, 197 thousand shares were bought and sold for approximately $11.89 million.
The stock lies in the lower part of a wide and weak rising trend in the short term, and this may normally pose a very good buying opportunity. If the lower trend floor at $59.71 is broken, it will firstly indicate a slower rate of rising, but may also be an early warning for a trend shift. Given the current short-term trend, the stock is expected to rise 3.14% during the next 3 months and, with a 90% probability hold a price between $61.58 and $68.78 at the end of this 3-month period.
Ready to grow your portfolio? Here's your beginner's guide to opening a free brokerage account.
JBH.AX Signals & Forecast
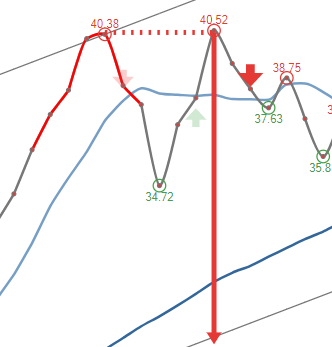
Volume is rising along with the price. This is considered to be a good technical signal. Some negative signals were issued as well, and these may have some influence on the near short-term development. The JB Hi-Fi Limited stock holds sell signals from both short and long-term Moving Averages giving a more negative forecast for the stock. Also, there is a general sell signal from the relation between the two signals where the long-term average is above the short-term average. On corrections up, there will be some resistance from the lines at $60.67 and $62.09. A break-up above any of these levels will issue buy signals. A sell signal was issued from a pivot top point on Tuesday, April 02, 2024, and so far it has fallen -7.52%. Further fall is indicated until a new bottom pivot has been found. Furthermore, there is currently a sell signal from the 3 month Moving Average Convergence Divergence (MACD).
 A sell signal from a double top formation was found on Tuesday, April 02, 2024 and based on theory for this formation the price should fall by -14.57% to $51.55 within 28 trading days since signal was issued (Monday, May 06, 2024).
Support, Risk & Stop-loss for JB Hi-Fi Limited stock
JB Hi-Fi Limited finds support from accumulated volume at $59.68 and this level may hold a buying opportunity as an upwards reaction can be expected when the support is being tested.
This stock is usually traded at a good volume, and with minor daily changes, the risk is considered to be low. During the last day, the stock moved $0.89 (1.49%) between high and low. For the last week, the stock has had daily average volatility of 1.34%.
Our recommended stop-loss: $57.59 (-4.56%) (This stock has low daily movements and this gives low risk. There is a sell signal from a pivot top found 22 days ago.)
Trading Expectations (JBH.AX) For The Upcoming Trading Day Of Monday 6th
For the upcoming trading day on Monday, 6th we expect JB Hi-Fi Limited to open at $60.34, and during the day (based on 14 day Average True Range), to move between $59.12 and $61.56, which gives a possible trading interval of +/-$1.22 (+/-2.03%) up or down from last closing price. If JB Hi-Fi Limited takes out the full calculated possible swing range there will be an estimated 4.06% move between the lowest and the highest trading price during the day.
Since the stock is closer to the resistance from accumulated volume at $60.73 (0.65%) than the support at $59.68 (1.09%), our systems don't find the trading risk/reward intra-day attractive and any bets should be held until the stock is closer to the support level.
Is JB Hi-Fi Limited stock A Buy?
JB Hi-Fi Limited holds several negative signals and this should be a sell candidate, but due to the general chance for a turnaround situation it should be considered as a hold candidate (hold or accumulate) in this position whilst awaiting further development.
Current score: -0.090 Hold/Accumulate Unchanged
Predicted Opening Price for JB Hi-Fi Limited of Monday, May 6, 2024
| Fair opening price May 6, 2024 | Current price |
|---|---|
| $60.34 ( 0.0055%) | $60.34 |
The predicted opening price is based on yesterday's movements between high, low, and closing price.
Trading levels for JBH.AX
Fibonacci Support & Resistance Levels
| Level | Price | |||
|---|---|---|---|---|
| Resistance | R3 | 61.23 | 1.47 % | |
| R2 | 60.89 | 0.91 % | ||
| R1 | 60.68 | 0.558 % | ||
| Current price: | 60.34 | |||
| Support | S1 | 60.00 | -0.569 % | |
| S2 | 59.79 | -0.92 % | ||
| S3 | 59.45 | -1.48 % |
Accumulated Volume Support & Resistance Levels
| Level | Price | |||
|---|---|---|---|---|
| Resistance | R3 | 64.02 | 6.10 % | |
| R2 | 63.96 | 6.00 % | ||
| R1 | 60.73 | 0.646 % | ||
| Current price | 60.34 | |||
| Support | S1 | 59.68 | -1.09% | |
| S2 | 59.51 | -1.38% | ||
| S3 | 58.75 | -2.64% |
JBH Dividend Payout History
| # | Ex-Date | Pay Date | Amount | Yield | |
|---|---|---|---|---|---|
| 1 | Feb 22, 2024 | Feb 22, 2024 | Mar 08, 2024 | $1.58 | 2.66% |
| 2 | Feb 23, 2023 | Feb 23, 2023 | Feb 23, 2023 | $1.97 | 4.59% |
| 3 | Aug 25, 2022 | Aug 25, 2022 | Aug 25, 2022 | $1.53 | 3.69% |
| 4 | Feb 23, 2022 | Feb 23, 2022 | Feb 23, 2022 | $1.63 | 3.25% |
| 5 | Aug 26, 2021 | Aug 26, 2021 | Aug 26, 2021 | $1.07 | 2.32% |
FAQ
Click here for our free guide on how to buy JB Hi-Fi Limited Stock.