Tracsis plc Stock Forecast
Tracsis plc stock price ended at £904.00 on Friday, after losing 0%.
(Updated on May 03, 2024)
No changes to the price of Tracsis plc stock on the last trading day (Friday, 3rd May 2024). During the last trading day the stock fluctuated 0% from a day low at £904.00 to a day high of £904.00. The price has risen in 5 of the last 10 days and is up by 6.35% over the past 2 weeks.
The stockhas broken the wide and falling short-term trend up. Firstly a slower falling rate is indicated, but this may very well be an early signal of a trend shift. On the reaction, there will be support on the roof of the current trend broken, which is £903.25, a level that may pose a second chance to hit a runner. According to fan-theory £1,003.93 will be the next possible trend-top level and thereby pose a resistance level that may not be broken at the first attempt.
Ready to grow your portfolio? Here's your beginner's guide to opening a free brokerage account.
TRCS.L Signals & Forecast
The Tracsis plc stock holds buy signals from both short and long-term Moving Averages giving a positive forecast for the stock, but the stock has a general sell signal from the relation between the two signals where the long-term average is above the short-term average. On corrections down, there will be some support from the lines at £867.57 and £878.26. A breakdown below any of these levels will issue sell signals. Furthermore, there is a buy signal from the 3 month Moving Average Convergence Divergence (MACD). Some negative signals were issued as well, and these may have some influence on the near short-term development. A sell signal was issued from a pivot top point on Thursday, May 02, 2024, and so far it has fallen 0%. Further fall is indicated until a new bottom pivot has been found. Volume fell on the last day without any changes to the price. This does not cause any direct divergence but may be an early warning and a possible "turning point". The very low volume increases the risk and reduces the other technical signals issued.
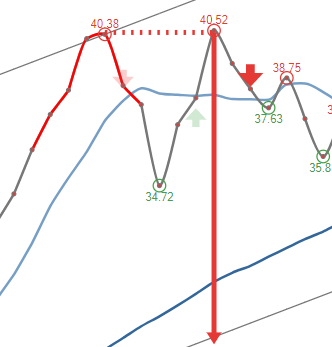 A sell signal from a double top formation was found on Tuesday, February 27, 2024 and based on theory for this formation the price should fall by -1.55% to £890.00 within 4 trading days since signal was issued (Tuesday, May 07, 2024).
Support, Risk & Stop-loss for Tracsis plc stock
Tracsis plc finds support from accumulated volume at £865.00 and this level may hold a buying opportunity as an upwards reaction can be expected when the support is being tested.
In general the stock tends to have very controlled movements and therefore the general risk is considered very low. However, be aware of low or falling volume and make sure to keep an eye on the stock During the last day, the stock moved £0 between high and low, or 0%. For the last week the stock has had daily average volatility of 2.89%
Our recommended stop-loss: £871.46 (-3.60%) (This stock has low daily movements and this gives low risk. There is a sell signal from a pivot top found 1 day ago.)
Trading Expectations (TRCS.L) For The Upcoming Trading Day Of Tuesday 7th
For the upcoming trading day on Tuesday, 7th we expect Tracsis plc to open at £904.00, and during the day (based on 14 day Average True Range), to move between £880.92 and £927.08, which gives a possible trading interval of +/-£23.08 (+/-2.55%) up or down from last closing price. If Tracsis plc takes out the full calculated possible swing range there will be an estimated 5.11% move between the lowest and the highest trading price during the day.
Since the stock is closer to the resistance from accumulated volume at £910.00 (0.66%) than the support at £865.00 (4.31%), our systems don't find the trading risk/reward intra-day attractive and any bets should be held until the stock is closer to the support level.
Is Tracsis plc stock A Buy?
Tracsis plc holds several positive signals, but we still don't find these to be enough for a buy candidate. At the current level, it should be considered as a hold candidate (hold or accumulate) in this position whilst awaiting further development.
Current score: -0.072 Hold/Accumulate Unchanged
Predicted Opening Price for Tracsis plc of Tuesday, May 7, 2024
| Fair opening price May 7, 2024 | Current price |
|---|---|
| £904.00 ( 0%) | £904.00 |
The predicted opening price is based on yesterday's movements between high, low, and closing price.
Trading levels for TRCS.L
Fibonacci Support & Resistance Levels
| Level | Price | |||
|---|---|---|---|---|
| Resistance | R3 | 904.00 | . | |
| R2 | 904.00 | . | ||
| R1 | 904.00 | . | ||
| Current price: | 904.00 | |||
| Support | S1 | 904.00 | . | |
| S2 | 904.00 | . | ||
| S3 | 904.00 | . |
Accumulated Volume Support & Resistance Levels
| Level | Price | |||
|---|---|---|---|---|
| Resistance | R3 | 925.00 | 2.32 % | |
| R2 | 920.00 | 1.77 % | ||
| R1 | 910.00 | 0.664 % | ||
| Current price | 904.00 | |||
| Support | S1 | 865.00 | -4.31% | |
| S2 | 850.00 | -5.97% | ||
| S3 | 820.00 | -9.29% |
TRCS Dividend Payout History
| # | Ex-Date | Pay Date | Amount | Yield | |
|---|---|---|---|---|---|
| 1 | May 09, 2024 | May 09, 2024 | May 24, 2024 | £1.10 | 0.122% |
| 2 | Jan 25, 2024 | Jan 25, 2024 | Jan 25, 2024 | £0 | 0% |
| 3 | Apr 20, 2023 | Apr 20, 2023 | Apr 20, 2023 | £1.00 | 0.108% |
| 4 | Nov 09, 2022 | Jan 26, 2023 | Feb 10, 2023 | £1.10 | 0.113% |
| 5 | Apr 07, 2022 | Apr 14, 2022 | May 06, 2022 | £0.90 | 0.0855% |
FAQ
Click here for our free guide on how to buy Tracsis plc Stock.