Spire Healthcare Group PLC Stock Forecast
Spire Healthcare Group PLC stock price down 0.202% on Thursday
(Updated on Apr 25, 2024)
The Spire Healthcare Group PLC stock price fell by -0.202% on the last day (Thursday, 25th Apr 2024) from £247.50 to £247.00. During the last trading day the stock fluctuated 1.63% from a day low at £246.00 to a day high of £250.00. The price has risen in 4 of the last 10 days and is up by 3.78% over the past 2 weeks. Volume fell on the last day along with the stock, which is actually a good sign as volume should follow the stock. On the last day, the trading volume fell by -765 thousand shares and in total, 209 thousand shares were bought and sold for approximately £51.56 million.
The stockis at the upper part of a horizontal trend and normally this may pose a good selling opportunity but a break-up through the top trend line at £248.18 will give a strong buy signal and a trend shift could be expected. Given the current horizontal trend, you can expect Spire Healthcare Group PLC stock with a 90% probability to be traded between £227.89 and £250.41 at the end of this 3-month period. A break of a horizontal trend is often followed by a large increase in the volume, and stocks seldom manage to go directly from the bottom of a trend up to the top. Stocks turning up in the middle of a horizontal trend are therefore considered to be potential runners.
Ready to grow your portfolio? Here's your beginner's guide to opening a free brokerage account.
SPI.L Signals & Forecast
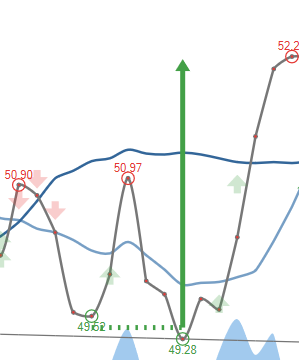
The Spire Healthcare Group PLC stock holds buy signals from both short and long-term Moving Averages giving a positive forecast for the stock. Also, there is a general buy signal from the relation between the two signals where the short-term average is above the long-term average. On corrections down, there will be some support from the lines at £245.86 and £236.67. A breakdown below any of these levels will issue sell signals. Furthermore, there is a buy signal from the 3 month Moving Average Convergence Divergence (MACD). Some negative signals were issued as well, and these may have some influence on the near short-term development. A sell signal was issued from a pivot top point on Thursday, April 18, 2024, and so far it has fallen -0.403%. Further fall is indicated until a new bottom pivot has been found. Volume fell together with the price during the last trading day and this reduces the overall risk as volume should follow the price movements.
 A buy signal from a double bottom formation was found on Wednesday, March 20, 2024 with a target of £240.93. Despite whether the objective of the signal formation has been reached the stock may continue to perform well.
Support, Risk & Stop-loss for Spire Healthcare Group PLC stock
Spire Healthcare Group PLC finds support from accumulated volume at £238.50 and this level may hold a buying opportunity as an upwards reaction can be expected when the support is being tested.
This stock is usually traded at a good volume, and with minor daily changes, the risk is considered to be low. During the last day, the stock moved £4.00 (1.63%) between high and low. For the last week, the stock has had daily average volatility of 1.46%.
Our recommended stop-loss: £238.06 (-3.62%) (This stock has low daily movements and this gives low risk. There is a sell signal from a pivot top found 5 days ago.)
Trading Expectations (SPI.L) For The Upcoming Trading Day Of Friday 26th
For the upcoming trading day on Friday, 26th we expect Spire Healthcare Group PLC to open at £247.67, and during the day (based on 14 day Average True Range), to move between £240.18 and £253.82, which gives a possible trading interval of +/-£6.82 (+/-2.76%) up or down from last closing price. If Spire Healthcare Group PLC takes out the full calculated possible swing range there will be an estimated 5.52% move between the lowest and the highest trading price during the day.
Since the stock is closer to the resistance from accumulated volume at £247.50 (0.20%) than the support at £238.50 (3.44%), our systems don't find the trading risk/reward intra-day attractive and any bets should be held until the stock is closer to the support level.
Is Spire Healthcare Group PLC stock A Buy?
Several short-term signals are positive and we conclude that the current level may hold a buying opportunity, as there is a fair chance for Spire Healthcare Group PLC stock to perform well in the short-term period.
Current score: 3.852 Buy Candidate Unchanged
Predicted Opening Price for Spire Healthcare Group PLC of Friday, April 26, 2024
| Fair opening price April 26, 2024 | Current price |
|---|---|
| £247.67 ( 0.270%) | £247.00 |
The predicted opening price is based on yesterday's movements between high, low, and closing price.
Trading levels for SPI.L
Fibonacci Support & Resistance Levels
| Level | Price | |||
|---|---|---|---|---|
| Resistance | R3 | 251.67 | 1.89 % | |
| R2 | 250.14 | 1.27 % | ||
| R1 | 249.19 | 0.89 % | ||
| Current price: | 247.00 | |||
| Support | S1 | 246.14 | -0.349 % | |
| S2 | 245.19 | -0.731 % | ||
| S3 | 243.67 | -1.35 % |
Accumulated Volume Support & Resistance Levels
| Level | Price | |||
|---|---|---|---|---|
| Resistance | R3 | 0 | . | |
| R2 | 248.00 | 0.405 % | ||
| R1 | 247.50 | 0.202 % | ||
| Current price | 247.00 | |||
| Support | S1 | 238.50 | -3.44% | |
| S2 | 234.00 | -5.26% | ||
| S3 | 230.00 | -6.88% |
SPI Dividend Payout History
| # | Ex-Date | Pay Date | Amount | Yield | |
|---|---|---|---|---|---|
| 1 | May 23, 2024 | May 23, 2024 | Jun 21, 2024 | £2.10 | 0.85% |
| 2 | Mar 02, 2023 | May 25, 2023 | Jun 23, 2023 | £0.500 | 0.234% |
| 3 | Mar 05, 2020 | May 28, 2020 | Jun 23, 2020 | £2.50 | 2.84% |
| 4 | Sep 16, 2019 | Nov 14, 2019 | Dec 10, 2019 | £1.30 | 1.09% |
| 5 | Feb 28, 2019 | May 30, 2019 | Jun 25, 2019 | £2.50 | 2.10% |
FAQ
Click here for our free guide on how to buy Spire Healthcare Group PLC Stock.