TRC Companies Inc Fund Forecast
Red day on Wednesday for TRC Companies Inc fund after losing 0%
(Updated on Aug 09, 2017)
No changes to the price of TRC Companies Inc fund on the last trading day (Wednesday, 9th Aug 2017). During the last trading day the fund fluctuated 0.571% from a day low at $17.50 to a day high of $17.60. The price has been going up and down for this period, and there has been a 0% change for the last 2 weeks.
The fund is moving within a narrow and horizontal trend and further movements within this trend can be expected. Given the current horizontal trend, you can expect TRC Companies Inc fund with a 90% probability to be traded between $17.57 and $17.68 at the end of this 3-month period. A break of a horizontal trend is often followed by a large increase in the volume, and funds seldom manage to go directly from the bottom of a trend up to the top. Funds turning up in the middle of a horizontal trend are therefore considered to be potential runners.
Ready to grow your portfolio? Here's your beginner's guide to opening a free brokerage account.
TRR Signals & Forecast
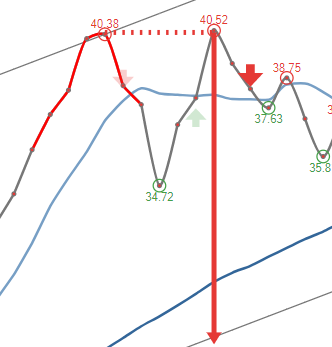
There are mixed signals in the fund today. A sell signal was issued from a pivot top point on Tuesday, August 08, 2017, and so far it has fallen 0%. Further fall is indicated until a new bottom pivot has been found. Volume fell on the last day without any changes to the price. This does not cause any direct divergence but may be an early warning and a possible "turning point". The fund had a Golden Star Signal on Thursday, June 15, 2017 in the short-term chart.
Golden Star Signal is when the short-term moving average, the long-term moving average, and price line meet in a special combination. This combination is very rare and often followed by long and strong gains for the fund in question.
Support, Risk & Stop-loss for TRC Companies Inc fund
TRC Companies Inc finds support from accumulated volume at $17.50 and this level may hold a buying opportunity as an upwards reaction can be expected when the support is being tested.
In general the fund tends to have very controlled movements and therefore the general risk is considered very low. However, be aware of low or falling volume and make sure to keep an eye on the fund During the last day, the fund moved $0.100 between high and low, or 0.571%. For the last week the fund has had daily average volatility of 0.343%
Our recommended stop-loss: We hold a negative evaluation for this stock. No stop-loss is set.
Trading Expectations (TRR) For The Upcoming Trading Day Of Thursday 10th
For the upcoming trading day on Thursday, 10th we expect TRC Companies Inc to open at $17.55, and during the day (based on 14 day Average True Range), to move between $17.49 and $17.61, which gives a possible trading interval of +/-$0.0638 (+/-0.36%) up or down from last closing price. If TRC Companies Inc takes out the full calculated possible swing range there will be an estimated 0.73% move between the lowest and the highest trading price during the day.
With no resistance above and support from accumulated volume @ $17.50, some $0.0500 (0.28%) from the current price of $17.55, our system finds the risk reward attractive.
Is TRC Companies Inc fund A Buy?
TRC Companies Inc holds several negative signals and we believe that it will still perform weakly in the next couple of days or weeks. We, therefore, hold a negative evaluation of this fund.
Current score: -1.670 Sell Candidate Unchanged
Predicted Opening Price for TRC Companies Inc of Thursday, August 10, 2017
| Fair opening price August 10, 2017 | Current price |
|---|---|
| $17.55 ( 0%) | $17.55 |
The predicted opening price is based on yesterday's movements between high, low, and closing price.
Trading levels for TRR
Fibonacci Support & Resistance Levels
| Level | Price | |||
|---|---|---|---|---|
| Resistance | R3 | 17.65 | 0.570 % | |
| R2 | 17.61 | 0.352 % | ||
| R1 | 17.59 | 0.218 % | ||
| Current price: | 17.55 | |||
| Support | S1 | 17.51 | -0.218 % | |
| S2 | 17.49 | -0.352 % | ||
| S3 | 17.45 | -0.570 % |
Accumulated Volume Support & Resistance Levels
| Level | Price | |||
|---|---|---|---|---|
| Resistance | R3 | 0 | . | |
| R2 | 0 | . | ||
| R1 | 0 | . | ||
| Current price | 17.55 | |||
| Support | S1 | 17.50 | -0.285% | |
| S2 | 17.45 | -0.570% | ||
| S3 | 0 | . |
FAQ
Click here for our free guide on how to buy TRC Companies Inc Fund.