Warren Buffett Indicator Hits Record Highs, Surpassing Dot-Com and Financial Crisis Levels
 Lukas Schmidt


The 'Warren Buffett Indicator' has once again sounded the alarm, signaling that current stock market levels have now eclipsed even the heights of the Dot-Com Bubble and the Great Financial Crisis. If you're a stock trader, it's time to pay attention — history might be offering some valuable lessons.
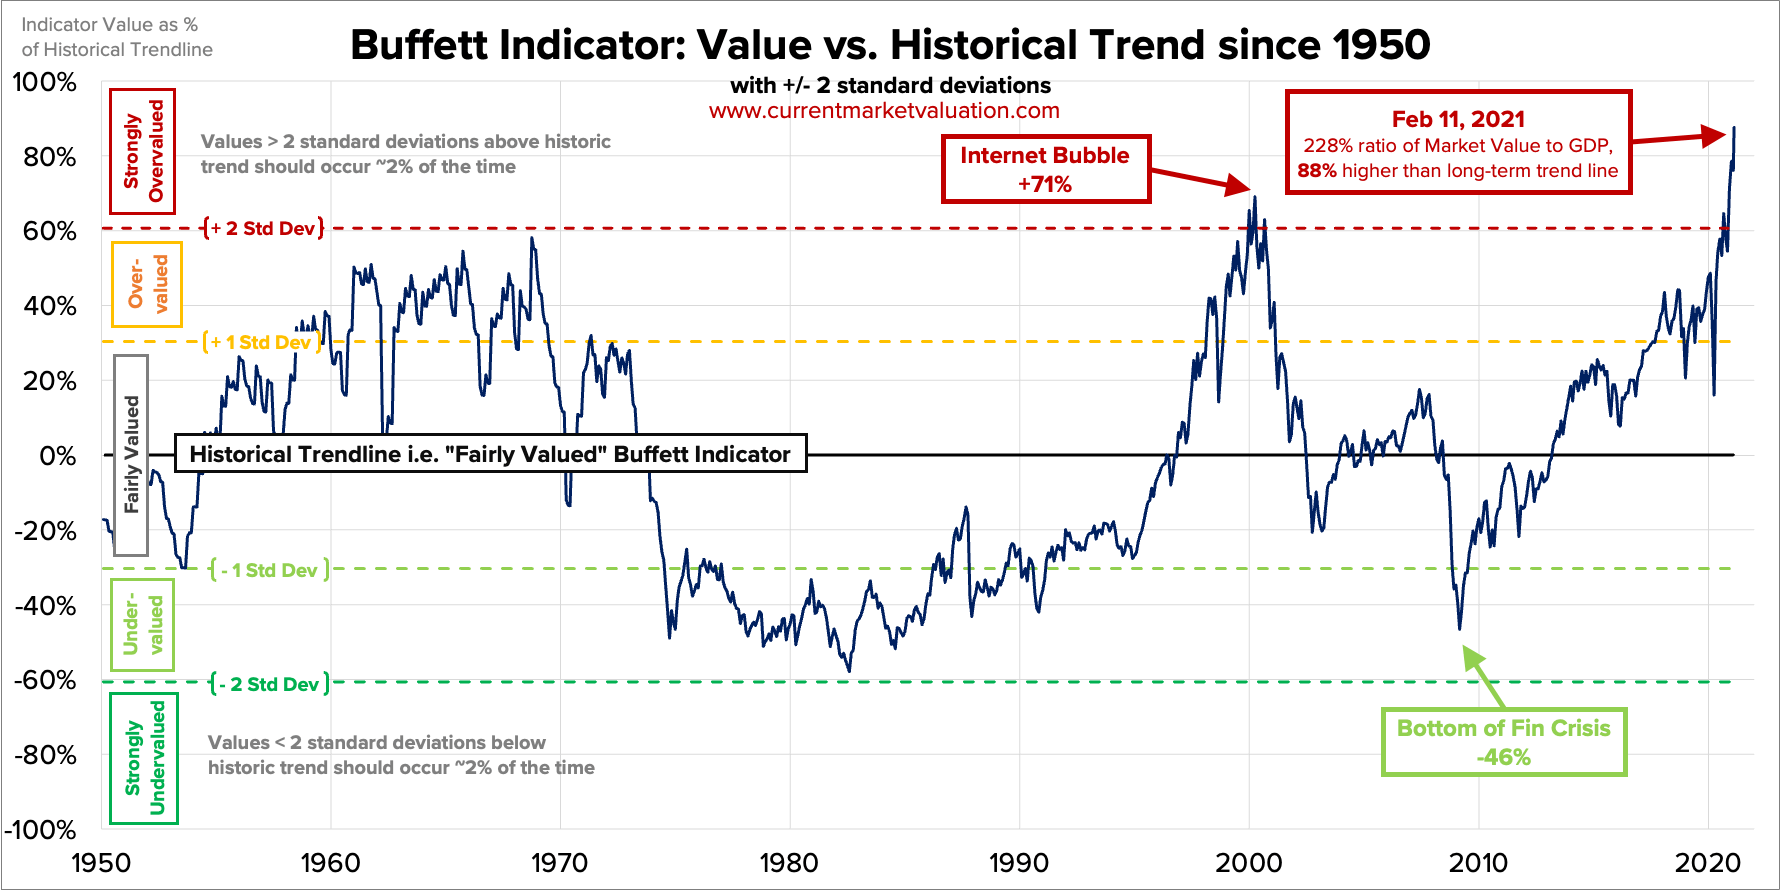
Warren Buffett, the legendary CEO of Berkshire Hathaway Inc (NYSE: BRK-A), is not new to navigating through exuberant bull markets. Following the Dot-Com Bubble burst in 2000, Buffett highlighted a key metric: the comparison of the market capitalization of stocks to the Gross Domestic Product (GDP). According to him, this ratio provides the most reliable indication of whether equities are overvalued or undervalued.
The so-called 'Warren Buffett Indicator' is essentially the ratio of the total market index to the U.S. GDP. The Wilshire 5000, a market-cap-weighted index encompassing all U.S. publicly traded companies, serves as the basis for this total market index. As of now, the 'Buffett Indicator' has reached a staggering 195%, marking its highest level ever recorded. This surpasses not only the Dot-Com Bubble but also the Global Financial Crisis and the 2022 Bear Market.
To put these numbers in perspective, back in 2000, when speculative frenzy enveloped internet stocks like Pets.com, the Buffett Indicator was around 140%. In 2007, just before the subprime mortgage crisis wreaked havoc, the ratio was at approximately 110%.
Now, despite higher interest rates, the valuations of major tech giants such as Tesla Inc (NASDAQ: TSLA) and NVIDIA Corp (NASDAQ: NVDA) have refused to cool off. Both companies are trading at forward price-to-earnings ratios above 50, which is significantly higher than the historical average for S&P 500 firms. Nevertheless, robust earnings projections suggest that over time, these lofty multiples might normalize as earnings continue to grow.
Ryan Detrick, the chief market strategist at Carson Group, recently highlighted on X that forward earnings expectations have been on the rise for the past few years. This could explain why investors are still paying a premium for stocks despite seemingly inflated valuations.
So, what does this mean for the future? Will the elevated 'Buffett Indicator' be a precursor to another market crash? The answer hinges on whether earnings growth can keep pace, thereby elevating GDP and bringing the Wilshire 5000 to GDP ratio back closer to its historical norms.
About The Author
Lukas Schmidt
Read Next in Latest Stock Market News