Guorui Properties Limited Stock Forecast
Guorui Properties Limited stock price down 0% on Thursday
(Updated on Apr 25, 2024)
No changes to the price of Guorui Properties Limited stock on the last trading day (Thursday, 25th Apr 2024). During the last trading day the stock fluctuated 0% from a day low at HK$0.0310 to a day high of HK$0.0310. The price has fallen in 4 of the last 10 days and is down by -3.13% for this period.
The stock lies in the middle of a very wide and strong rising trend in the short term and a further rise within the trend is signaled. Given the current short-term trend, the stock is expected to rise 23.79% during the next 3 months and, with a 90% probability hold a price between HK$0.0350 and HK$0.0508 at the end of this 3-month period.
Ready to grow your portfolio? Here's your beginner's guide to opening a free brokerage account.
2329.HK Signals & Forecast
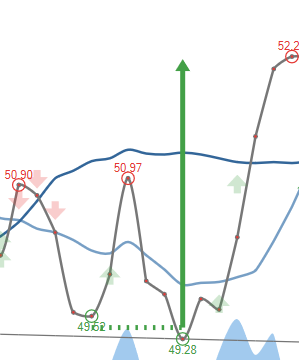
There are few to no technical positive signals at the moment. The Guorui Properties Limited stock holds sell signals from both short and long-term Moving Averages giving a more negative forecast for the stock. On corrections up, there will be some resistance from the lines at HK$0.0316 and HK$0.0315. A break-up above any of these levels will issue buy signals. A sell signal was issued from a pivot top point on Monday, April 08, 2024, and so far it has fallen -8.82%. Further fall is indicated until a new bottom pivot has been found. Furthermore, there is currently a sell signal from the 3 month Moving Average Convergence Divergence (MACD). Volume fell on the last day without any changes to the price. This does not cause any direct divergence but may be an early warning and a possible "turning point". The very low volume increases the risk and reduces the other technical signals issued.
 A buy signal from a double bottom formation was found on Thursday, February 15, 2024 and based on theory for this formation the price should go up by 9.68% to HK$0.0340 within 6 trading days since signal was issued (Friday, April 26, 2024).
Support, Risk & Stop-loss for Guorui Properties Limited stock
Guorui Properties Limited finds support from accumulated volume at HK$0.0300 and this level may hold a buying opportunity as an upwards reaction can be expected when the support is being tested.
This stock has average movements during the day, but be aware of low or falling volume as this increases the risk. During the last day, the stock moved HK$0 between high and low, or 0%. For the last week the stock has had daily average volatility of 4.07%.
Our recommended stop-loss: We hold a negative evaluation for this stock. No stop-loss is set.
Trading Expectations (2329.HK) For The Upcoming Trading Day Of Friday 26th
For the upcoming trading day on Friday, 26th we expect Guorui Properties Limited to open at HK$0.0310, and during the day (based on 14 day Average True Range), to move between HK$0.0283 and HK$0.0337, which gives a possible trading interval of +/-HK$0.0027 (+/-8.83%) up or down from last closing price. If Guorui Properties Limited takes out the full calculated possible swing range there will be an estimated 17.66% move between the lowest and the highest trading price during the day.
Since the stock is closer to the resistance from accumulated volume at HK$0.0320 (3.23%) than the support at HK$0.0300 (3.23%), our systems don't find the trading risk/reward intra-day attractive and any bets should be held until the stock is closer to the support level.
Is Guorui Properties Limited stock A Buy?
The Guorui Properties Limited stock holds several negative signals and despite the positive trend, we believe Guorui Properties Limited will perform weakly in the next couple of days or weeks. Therefore, we hold a negative evaluation of this stock.
Current score: -4.044 Sell Candidate Unchanged
Predicted Opening Price for Guorui Properties Limited of Friday, April 26, 2024
| Fair opening price April 26, 2024 | Current price |
|---|---|
| HK$0.0310 ( 0%) | HK$0.0310 |
The predicted opening price is based on yesterday's movements between high, low, and closing price.
Trading levels for 2329.HK
Fibonacci Support & Resistance Levels
| Level | Price | |||
|---|---|---|---|---|
| Resistance | R3 | 0.0310 | . | |
| R2 | 0.0310 | . | ||
| R1 | 0.0310 | . | ||
| Current price: | 0.0310 | |||
| Support | S1 | 0.0310 | . | |
| S2 | 0.0310 | . | ||
| S3 | 0.0310 | . |
Accumulated Volume Support & Resistance Levels
| Level | Price | |||
|---|---|---|---|---|
| Resistance | R3 | 0.0350 | 12.90 % | |
| R2 | 0.0330 | 6.45 % | ||
| R1 | 0.0320 | 3.23 % | ||
| Current price | 0.0310 | |||
| Support | S1 | 0.0300 | -3.23% | |
| S2 | 0.0290 | -6.45% | ||
| S3 | 0.0240 | -22.58% |
2329 Dividend Payout History
| # | Ex-Date | Pay Date | Amount | Yield | |
|---|---|---|---|---|---|
| 1 | Mar 31, 2020 | Aug 12, 2020 | Aug 31, 2020 | HK$0.0376 | 3.27% |
| 2 | Mar 29, 2019 | May 30, 2019 | Jun 20, 2019 | HK$0.0564 | 3.97% |
| 3 | Mar 28, 2018 | May 31, 2018 | Jun 20, 2018 | HK$0.0807 | 3.12% |
| 4 | Aug 28, 2017 | Sep 14, 2017 | Sep 29, 2017 | HK$0.0752 | 2.82% |
| 5 | Mar 27, 2017 | May 31, 2017 | Jun 15, 2017 | HK$0.0604 | 2.45% |
FAQ
Click here for our free guide on how to buy Guorui Properties Limited Stock.