Sunwoda Electronic Co Ltd Stock Forecast
Green day on Monday for Sunwoda Electronic Co Ltd
(Updated on May 06, 2024)
The Sunwoda Electronic Co Ltd stock price gained 1.38% on the last trading day (Monday, 6th May 2024), rising from ¥15.21 to ¥15.42. During the last trading day the stock fluctuated 2.30% from a day low at ¥15.25 to a day high of ¥15.60. The price has fallen in 6 of the last 10 days but is still up by 8.67% over the past 2 weeks. Volume fell on the last day by -76 thousand shares and in total, 40 million shares were bought and sold for approximately ¥609.27 million. You should take into consideration that falling volume on higher prices causes divergence and may be an early warning about possible changes over the next couple of days.
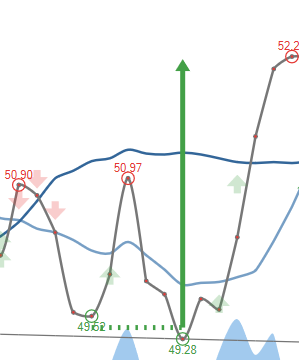
The stock has broken the wide and weak rising the short-term trend up and an even stronger rate of rising is indicated. For any reaction back there will now be support on the roof on the current trend broken at ¥15.03, a level that may pose a second chance to hit a runner. According to fan-theory ¥16.58 will be the next possible trend-top level and thereby pose a resistance level that may not be broken at the first attempt.
Ready to grow your portfolio? Here's your beginner's guide to opening a free brokerage account.
300207.SZ Signals & Forecast
The Sunwoda Electronic Co Ltd stock holds buy signals from both short and long-term Moving Averages giving a positive forecast for the stock. Also, there is a general buy signal from the relation between the two signals where the short-term average is above the long-term average. On corrections down, there will be some support from the lines at ¥14.48 and ¥14.21. A breakdown below any of these levels will issue sell signals. A buy signal was issued from a pivot bottom point on Wednesday, April 24, 2024, and so far it has risen 14.99%. Further rise is indicated until a new top pivot has been found. Furthermore, there is a buy signal from the 3 month Moving Average Convergence Divergence (MACD). Volume fell during the last trading day despite gaining prices. This causes a divergence between volume and price and it may be an early warning. The stock should be watched closely.
 A buy signal from a double bottom formation was found on Wednesday, April 24, 2024 with a target of ¥15.38. Despite whether the objective of the signal formation has been reached the stock may continue to perform well.
Support, Risk & Stop-loss for Sunwoda Electronic Co Ltd stock
Sunwoda Electronic Co Ltd finds support from accumulated volume at ¥15.22 and this level may hold a buying opportunity as an upwards reaction can be expected when the support is being tested.
This stock has average movements during the day and with good trading volume, the risk is considered to be medium. During the last day, the stock moved ¥0.350 between high and low, or 2.30%. For the last week, the stock has had daily average volatility of 6.47%.
Our recommended stop-loss: ¥14.92 (-3.24%) (This stock has medium daily movements and this gives medium risk. There is a buy signal from a pivot bottom found 5 days ago.)
Trading Expectations (300207.SZ) For The Upcoming Trading Day Of Tuesday 7th
For the upcoming trading day on Tuesday, 7th we expect Sunwoda Electronic Co Ltd to open at ¥15.42, and during the day (based on 14 day Average True Range), to move between ¥14.68 and ¥16.16, which gives a possible trading interval of +/-¥0.741 (+/-4.81%) up or down from last closing price. If Sunwoda Electronic Co Ltd takes out the full calculated possible swing range there will be an estimated 9.61% move between the lowest and the highest trading price during the day.
With no resistance above and support from accumulated volume @ ¥15.22, some ¥0.200 (1.30%) from the current price of ¥15.42, our system finds the risk reward attractive.
Is Sunwoda Electronic Co Ltd stock A Buy?
Sunwoda Electronic Co Ltd holds several positive signals, but we still don't find these to be enough for a buy candidate. At the current level, it should be considered as a hold candidate (hold or accumulate) in this position whilst awaiting further development.
Current score: 0.000 Hold/Accumulate Unchanged
Zero in score indicates that our system is expecting high volatility and risk for the following trading day. Given the latest developments, we cannot determine the next direction as it may go both ways.
Predicted Opening Price for Sunwoda Electronic Co Ltd of Tuesday, May 7, 2024
| Fair opening price May 7, 2024 | Current price |
|---|---|
| ¥15.42 ( 0.0216%) | ¥15.42 |
The predicted opening price is based on yesterday's movements between high, low, and closing price.
Trading levels for 300207.SZ
Fibonacci Support & Resistance Levels
| Level | Price | |||
|---|---|---|---|---|
| Resistance | R3 | 15.77 | 2.29 % | |
| R2 | 15.64 | 1.42 % | ||
| R1 | 15.56 | 0.89 % | ||
| Current price: | 15.42 | |||
| Support | S1 | 15.29 | -0.85 % | |
| S2 | 15.21 | -1.38 % | ||
| S3 | 15.07 | -2.25 % |
Accumulated Volume Support & Resistance Levels
| Level | Price | |||
|---|---|---|---|---|
| Resistance | R3 | 0 | . | |
| R2 | 0 | . | ||
| R1 | 0 | . | ||
| Current price | 15.42 | |||
| Support | S1 | 15.22 | -1.30% | |
| S2 | 14.95 | -3.05% | ||
| S3 | 14.61 | -5.25% |
300207 Dividend Payout History
| # | Ex-Date | Pay Date | Amount | Yield | |
|---|---|---|---|---|---|
| 1 | Jun 14, 2023 | Jun 14, 2023 | Jun 14, 2023 | ¥0.0800 | 0.514% |
| 2 | Jul 08, 2022 | Jul 08, 2022 | Jul 08, 2022 | ¥0.0700 | 0.227% |
| 3 | Jun 04, 2021 | Jun 04, 2021 | Jun 04, 2021 | ¥0.0701 | 0.202% |
| 4 | May 29, 2020 | May 29, 2020 | May 29, 2020 | ¥0.0700 | 0.492% |
| 5 | Jun 25, 2019 | Jun 25, 2019 | Jun 25, 2019 | ¥0.130 | 1.16% |
FAQ
Click here for our free guide on how to buy Sunwoda Electronic Co Ltd Stock.