Albany International Corporation Stock Forecast
Explanation to Bollinger's Bands
Bollinger Bands was created by John Bollinger in the early 1980s, its purpose is to define price action relative to the assets highs and lows. This technical indicator is used to identify buy and sell signals and has proven very well in doing so.
Bollinger Bands consist of a set of three curves drawn in relation to securities prices. The middle band is a measure of the intermediate-term trend, usually a simple moving average, that serves as the base for the upper and lower bands. The interval between the upper and lower bands and the middle band is determined by volatility, typically the standard deviation of the same data that were used for the average. StockInvest.us uses Bollingers suggested 20 day average.
Middle Bollinger Band = 20-period simple moving average
Upper Bollinger Band = Middle Bollinger Band + 2 * 20-period standard deviation
Lower Bollinger Band = Middle Bollinger Band - 2 * 20-period standard deviation
BandWidth defines the current width of the band.
%b defines the current position within the band.
BandWidth = (Upper Bollinger Band - Lower Bollinger Band) / Middle Bollinger Band
%b = (Last - Lower Bollinger Band) / (Upper Bollinger Band - Lower Bollinger Band)
Live Samples:
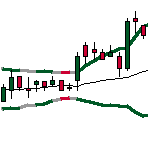
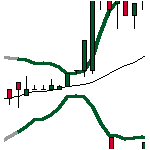
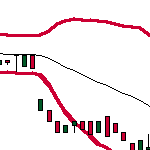
Bottlenecks in bandwidth indicate an upcoming change. Break up through the moving average line or continuous movements above the moving average line indicate a break up, and vice versa.
Source: http://www.bollingerbands.com
Albany International Corporation stock price up 0.343% on Friday
(Updated on Apr 26, 2024)
The Albany International Corporation stock price gained 0.343% on the last trading day (Friday, 26th Apr 2024), rising from $87.38 to $87.68. During the last trading day the stock fluctuated 0.89% from a day low at $87.33 to a day high of $88.11. The price has fallen in 6 of the last 10 days and is down by -2.08% for this period. Volume fell on the last day by -11 thousand shares and in total, 110 thousand shares were bought and sold for approximately $9.64 million. You should take into consideration that falling volume on higher prices causes divergence and may be an early warning about possible changes over the next couple of days.
The stock lies in the middle of a wide and falling trend in the short term and further fall within the trend is signaled. Given the current short-term trend, the stock is expected to fall -2.57% during the next 3 months and, with a 90% probability hold a price between $83.29 and $93.18 at the end of this 3-month period.
Ready to grow your portfolio? Here's your beginner's guide to opening a free brokerage account.
AIN Signals & Forecast
A buy signal was issued from a pivot bottom point on Thursday, April 25, 2024, and so far it has risen 0.343%. Further rise is indicated until a new top pivot has been found. Furthermore, there is a buy signal from the 3 month Moving Average Convergence Divergence (MACD). Volume fell during the last trading day despite gaining prices. This causes a divergence between volume and price and it may be an early warning. The stock should be watched closely. Some negative signals were issued as well, and these may have some influence on the near short-term development. The Albany International Corporation stock holds sell signals from both short and long-term Moving Averages giving a more negative forecast for the stock. Also, there is a general sell signal from the relation between the two signals where the long-term average is above the short-term average. On corrections up, there will be some resistance from the lines at $87.84 and $90.81. A break-up above any of these levels will issue buy signals.
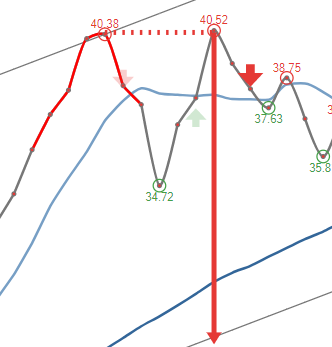 A sell signal from a double top formation was found on Wednesday, March 27, 2024 with a target of $88.93. Despite whether the objective of the signal formation has been reached the stock may continue to fall.
Support, Risk & Stop-loss for Albany International Corporation stock
Albany International Corporation finds support from accumulated volume at $87.57 and this level may hold a buying opportunity as an upwards reaction can be expected when the support is being tested.
In general the stock tends to have very controlled movements and with good liquidity the risk is considered very low in this stock. During the last day, the stock moved $0.780 between high and low, or 0.89%. For the last week the stock has had daily average volatility of 1.30%.
Our recommended stop-loss: We hold a negative evaluation for this stock. No stop-loss is set.
Trading Expectations (AIN) For The Upcoming Trading Day Of Monday 29th
For the upcoming trading day on Monday, 29th we expect Albany International Corporation to open at $87.71, and during the day (based on 14 day Average True Range), to move between $85.97 and $89.39, which gives a possible trading interval of +/-$1.71 (+/-1.95%) up or down from last closing price. If Albany International Corporation takes out the full calculated possible swing range there will be an estimated 3.91% move between the lowest and the highest trading price during the day.
Since the stock is closer to the support from accumulated volume at $87.57 (0.13%) than the resistance at $88.08 (0.46%), our systems sees the trading risk/reward intra-day as attractive and believe profit can be made before the stock reaches first resistance..
Earnings coming up
Albany International Corporation will release earnings AMC on Monday, April 29, 2024.The consensus among the analysts for the expected earnings (EPS) is $0.87. We will update the financials statements for Albany International Corporation, that can be found here as soon as the records are public. Our systems has calculated a possible swing of +/- 2.42% in the first trading day after earnings release.
Is Albany International Corporation stock A Buy?
Albany International Corporation holds several negative signals and is within a wide and falling trend, so we believe it will still perform weakly in the next couple of days or weeks. We therefore hold a negative evaluation of this stock.
Current score: -2.336 Sell Candidate Unchanged
Predicted Opening Price for Albany International Corporation of Monday, April 29, 2024
| Fair opening price April 29, 2024 | Current price |
|---|---|
| $87.71 ( 0.0304%) | $87.68 |
The predicted opening price is based on yesterday's movements between high, low, and closing price.
Trading levels for AIN
Fibonacci Support & Resistance Levels
| Level | Price | |||
|---|---|---|---|---|
| Resistance | R3 | 88.49 | 0.92 % | |
| R2 | 88.19 | 0.580 % | ||
| R1 | 88.00 | 0.370 % | ||
| Current price: | 87.68 | |||
| Support | S1 | 87.41 | -0.309 % | |
| S2 | 87.22 | -0.519 % | ||
| S3 | 86.93 | -0.86 % |
Accumulated Volume Support & Resistance Levels
| Level | Price | |||
|---|---|---|---|---|
| Resistance | R3 | 91.16 | 3.97 % | |
| R2 | 88.73 | 1.20 % | ||
| R1 | 88.08 | 0.456 % | ||
| Current price | 87.68 | |||
| Support | S1 | 87.57 | -0.125% | |
| S2 | 87.38 | -0.342% | ||
| S3 | 0 | . |
AIN Dividend Payout History
| # | Ex-Date | Pay Date | Amount | Yield | |
|---|---|---|---|---|---|
| 1 | Feb 23, 2024 | Mar 14, 2024 | Apr 05, 2024 | $0.260 | 0.292% |
| 2 | Dec 08, 2023 | Dec 18, 2023 | Jan 08, 2024 | $0.260 | 0.282% |
| 3 | Aug 24, 2023 | Sep 01, 2023 | Oct 06, 2023 | $0.250 | 0.295% |
| 4 | May 12, 2023 | Jun 06, 2023 | Jul 10, 2023 | $0.250 | 0.276% |
| 5 | Feb 24, 2023 | Mar 16, 2023 | Jul 10, 2023 | $0.250 | 0.276% |
FAQ
Click here for our free guide on how to buy Albany International Corporation Stock.