AstroNova, Inc. Stock Forecast
AstroNova, Inc. stock upgraded from Sell Candidate to Buy Candidate after Wednesday trading session.
(Updated on May 01, 2024)
The AstroNova, Inc. stock price gained 2.32% on the last trading day (Wednesday, 1st May 2024), rising from $17.27 to $17.67. During the last trading day the stock fluctuated 2.43% from a day low at $17.25 to a day high of $17.67. The price has risen in 6 of the last 10 days and is up by 5.94% over the past 2 weeks. Volume has increased on the last day along with the price, which is a positive technical sign, and, in total, 1 thousand more shares were traded than the day before. In total, 7 thousand shares were bought and sold for approximately $121.87 thousand.
The stockis at the upper part of a horizontal trend and normally this may pose a good selling opportunity but a break-up through the top trend line at $17.87 will give a strong buy signal and a trend shift could be expected. Given the current horizontal trend, you can expect AstroNova, Inc. stock with a 90% probability to be traded between $16.30 and $17.75 at the end of this 3-month period. A break of a horizontal trend is often followed by a large increase in the volume, and stocks seldom manage to go directly from the bottom of a trend up to the top. Stocks turning up in the middle of a horizontal trend are therefore considered to be potential runners.
Ready to grow your portfolio? Here's your beginner's guide to opening a free brokerage account.
ALOT Signals & Forecast
The AstroNova, Inc. stock holds buy signals from both short and long-term Moving Averages giving a positive forecast for the stock, but the stock has a general sell signal from the relation between the two signals where the long-term average is above the short-term average. On corrections down, there will be some support from the lines at $17.42 and $17.48. A breakdown below any of these levels will issue sell signals. Furthermore, there is a buy signal from the 3 month Moving Average Convergence Divergence (MACD). AstroNova, Inc. has increased volume and follows the last lift in the price. This is considered to be a technical positive sign as volume should follow the price-formation. Higher liquidity also reduces the general risk. Some negative signals were issued as well, and these may have some influence on the near short-term development. A sell signal was issued from a pivot top point on Monday, April 22, 2024, and so far it has fallen -1.12%. Further fall is indicated until a new bottom pivot has been found.
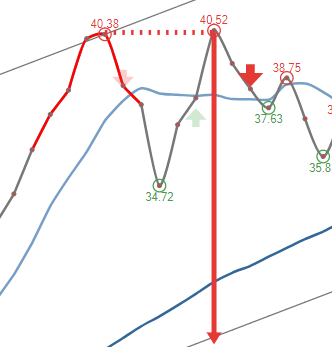 A sell signal from a double top formation was found on Monday, April 22, 2024 and based on theory for this formation the price should fall by -2.57% to $17.22 within 20 trading days since signal was issued (Thursday, May 02, 2024).
Support, Risk & Stop-loss for AstroNova, Inc. stock
AstroNova, Inc. finds support from accumulated volume at $17.60 and this level may hold a buying opportunity as an upwards reaction can be expected when the support is being tested.
This stock is usually traded at a good volume, and with minor daily changes, the risk is considered to be low. During the last day, the stock moved $0.420 (2.43%) between high and low. For the last week, the stock has had daily average volatility of 2.57%.
Our recommended stop-loss: $16.92 (-4.23%) (This stock has low daily movements and this gives low risk. There is a sell signal from a pivot top found 7 days ago.)
Trading Expectations (ALOT) For The Upcoming Trading Day Of Thursday 2nd
For the upcoming trading day on Thursday, 2nd we expect AstroNova, Inc. to open at $17.53, and during the day (based on 14 day Average True Range), to move between $17.17 and $18.17, which gives a possible trading interval of +/-$0.496 (+/-2.80%) up or down from last closing price. If AstroNova, Inc. takes out the full calculated possible swing range there will be an estimated 5.61% move between the lowest and the highest trading price during the day.
Since the stock is closer to the support from accumulated volume at $17.60 (0.40%) than the resistance at $17.80 (0.74%), our systems sees the trading risk/reward intra-day as attractive and believe profit can be made before the stock reaches first resistance..
Is AstroNova, Inc. stock A Buy?
Several short-term signals are positive and we conclude that the current level may hold a buying opportunity, as there is a fair chance for AstroNova, Inc. stock to perform well in the short-term period. We have upgraded our analysis conclusion for this stock since the last evaluation from a Sell to a Buy candidate.
Current score: 1.213 Buy Candidate Upgraded
Predicted Opening Price for AstroNova, Inc. of Thursday, May 2, 2024
| Fair opening price May 2, 2024 | Current price |
|---|---|
| $17.53 ( 0.792%) | $17.67 |
The predicted opening price is based on yesterday's movements between high, low, and closing price.
Trading levels for ALOT
Fibonacci Support & Resistance Levels
| Level | Price | |||
|---|---|---|---|---|
| Resistance | R3 | 17.95 | 1.58 % | |
| R2 | 17.79 | 0.677 % | ||
| R1 | 17.69 | 0.116 % | ||
| Current price: | 17.67 | |||
| Support | S1 | 17.37 | -1.70 % | |
| S2 | 17.27 | -2.26 % | ||
| S3 | 17.11 | -3.17 % |
Accumulated Volume Support & Resistance Levels
| Level | Price | |||
|---|---|---|---|---|
| Resistance | R3 | 17.87 | 1.13 % | |
| R2 | 17.85 | 1.02 % | ||
| R1 | 17.80 | 0.736 % | ||
| Current price | 17.67 | |||
| Support | S1 | 17.60 | -0.396% | |
| S2 | 17.44 | -1.30% | ||
| S3 | 17.14 | -3.00% |
ALOT Dividend Payout History
| # | Ex-Date | Pay Date | Amount | Yield | |
|---|---|---|---|---|---|
| 1 | Mar 12, 2020 | Mar 25, 2020 | Apr 02, 2020 | $0.0700 | 1.01% |
| 2 | Dec 03, 2019 | Dec 18, 2019 | Dec 26, 2019 | $0.0700 | 0.511% |
| 3 | Aug 28, 2019 | Sep 13, 2019 | Sep 24, 2019 | $0.0700 | 0.453% |
| 4 | Jun 06, 2019 | Jun 18, 2019 | Jun 26, 2019 | $0.0700 | 0.270% |
| 5 | Jun 05, 2019 | Jun 14, 2019 | Jun 24, 2019 | $0.0700 | 0.273% |
FAQ
Click here for our free guide on how to buy AstroNova, Inc. Stock.