Cicor Technologies Ltd. Stock Forecast
Cicor Technologies Ltd. stock price ended at 49.00 Fr on Monday, after losing 0%.
(Updated on May 06, 2024)
No changes to the price of Cicor Technologies Ltd. stock on the last trading day (Monday, 6th May 2024). During the last trading day the stock fluctuated 0% from a day low at 49.00 Fr to a day high of 49.00 Fr. The price has been going up and down for this period, and there has been a -2.78% loss for the last 2 weeks.
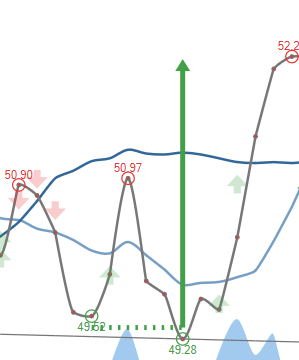
The stock is at the lower part of a horizontal trend in the short term, and normally this may pose a good buying opportunity, though a breakdown through the bottom trend line at 48.99 Fr will give a strong sell signal and a trend shift may be expected. Given the current horizontal trend, you can expect Cicor Technologies Ltd. stock with a 90% probability to be traded between 48.69 Fr and 52.45 Fr at the end of this 3-month period. A break of a horizontal trend is often followed by a large increase in the volume, and stocks seldom manage to go directly from the bottom of a trend up to the top. Stocks turning up in the middle of a horizontal trend are therefore considered to be potential runners.
Ready to grow your portfolio? Here's your beginner's guide to opening a free brokerage account.
CICN.SW Signals & Forecast
A buy signal was issued from a pivot bottom point on Friday, May 03, 2024, and so far it has fallen 0%. Further rise is indicated until a new top pivot has been found. Some negative signals were issued as well, and these may have some influence on the near short-term development. The Cicor Technologies Ltd. stock holds sell signals from both short and long-term Moving Averages giving a more negative forecast for the stock. Also, there is a general sell signal from the relation between the two signals where the long-term average is above the short-term average. On corrections up, there will be some resistance from the lines at 49.59 Fr and 50.49 Fr. A break-up above any of these levels will issue buy signals. Furthermore, there is currently a sell signal from the 3 month Moving Average Convergence Divergence (MACD). Volume fell on the last day without any changes to the price. This does not cause any direct divergence but may be an early warning and a possible "turning point". The very low volume increases the risk and reduces the other technical signals issued.
Support, Risk & Stop-loss for Cicor Technologies Ltd. stock
There is no support from accumulated volume below today's level and given the right condition the stock may perform very badly in the next couple of days.
In general the stock tends to have very controlled movements and therefore the general risk is considered very low. However, be aware of low or falling volume and make sure to keep an eye on the stock During the last day, the stock moved 0 Fr between high and low, or 0%. For the last week the stock has had daily average volatility of 0.93%
Our recommended stop-loss: We hold a negative evaluation for this stock. No stop-loss is set.
Trading Expectations (CICN.SW) For The Upcoming Trading Day Of Tuesday 7th
For the upcoming trading day on Tuesday, 7th we expect Cicor Technologies Ltd. to open at 49.00 Fr, and during the day (based on 14 day Average True Range), to move between 48.30 Fr and 49.70 Fr, which gives a possible trading interval of +/-0.697 Fr (+/-1.42%) up or down from last closing price. If Cicor Technologies Ltd. takes out the full calculated possible swing range there will be an estimated 2.85% move between the lowest and the highest trading price during the day.
With no support below and resistance from accumulated volume @ 51.00 Fr, some 2.00 Fr (4.08%) from the current price of 49.00 Fr, our system finds the risk reward not very attractive.
Is Cicor Technologies Ltd. stock A Buy?
Cicor Technologies Ltd. holds several negative signals and is within a falling trend, so we believe it will still perform weakly in the next couple of days or weeks. We therefore hold a negative evaluation of this stock.
Current score: -1.936 Sell Candidate Unchanged
Predicted Opening Price for Cicor Technologies Ltd. of Tuesday, May 7, 2024
| Fair opening price May 7, 2024 | Current price |
|---|---|
| 49.00 Fr ( 0%) | 49.00 Fr |
The predicted opening price is based on yesterday's movements between high, low, and closing price.
Trading levels for CICN.SW
Fibonacci Support & Resistance Levels
| Level | Price | |||
|---|---|---|---|---|
| Resistance | R3 | 49.00 | . | |
| R2 | 49.00 | . | ||
| R1 | 49.00 | . | ||
| Current price: | 49.00 | |||
| Support | S1 | 49.00 | . | |
| S2 | 49.00 | . | ||
| S3 | 49.00 | . |
Accumulated Volume Support & Resistance Levels
| Level | Price | |||
|---|---|---|---|---|
| Resistance | R3 | 51.40 | 4.90 % | |
| R2 | 51.20 | 4.49 % | ||
| R1 | 51.00 | 4.08 % | ||
| Current price | 49.00 | |||
| Support | S1 | 0 | . | |
| S2 | 0 | . | ||
| S3 | 0 | . |
CICN Dividend Payout History
| # | Ex-Date | Pay Date | Amount | Yield | |
|---|---|---|---|---|---|
| 1 | Apr 20, 2021 | Apr 20, 2021 | Apr 20, 2021 | 1.00 Fr | 1.99% |
| 2 | Mar 12, 2020 | Apr 21, 2020 | Apr 23, 2020 | 1.50 Fr | 3.98% |
| 3 | Apr 23, 2019 | Apr 23, 2019 | Apr 23, 2019 | 1.00 Fr | 1.70% |
| 4 | Apr 18, 2019 | Apr 18, 2019 | Apr 18, 2019 | 1.00 Fr | 1.71% |
| 5 | Mar 07, 2018 | Apr 23, 2018 | Apr 25, 2018 | 0.700 Fr | 1.25% |
FAQ
Click here for our free guide on how to buy Cicor Technologies Ltd. Stock.