Oncology Pharma Stock Forecast
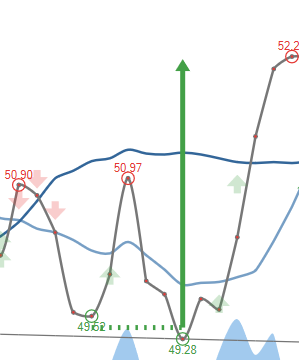
Explanation to Bollinger's Bands
Bollinger Bands was created by John Bollinger in the early 1980s, its purpose is to define price action relative to the assets highs and lows. This technical indicator is used to identify buy and sell signals and has proven very well in doing so.
Bollinger Bands consist of a set of three curves drawn in relation to securities prices. The middle band is a measure of the intermediate-term trend, usually a simple moving average, that serves as the base for the upper and lower bands. The interval between the upper and lower bands and the middle band is determined by volatility, typically the standard deviation of the same data that were used for the average. StockInvest.us uses Bollingers suggested 20 day average.
Middle Bollinger Band = 20-period simple moving average
Upper Bollinger Band = Middle Bollinger Band + 2 * 20-period standard deviation
Lower Bollinger Band = Middle Bollinger Band - 2 * 20-period standard deviation
BandWidth defines the current width of the band.
%b defines the current position within the band.
BandWidth = (Upper Bollinger Band - Lower Bollinger Band) / Middle Bollinger Band
%b = (Last - Lower Bollinger Band) / (Upper Bollinger Band - Lower Bollinger Band)
Live Samples:
Bottlenecks in bandwidth indicate an upcoming change. Break up through the moving average line or continuous movements above the moving average line indicate a break up, and vice versa.
Source: http://www.bollingerbands.com
Oncology Pharma stock price up more than 599,900.00% on Friday
(Updated on Apr 26, 2024)
The Oncology Pharma stock price gained 599,900.00% on the last trading day (Friday, 26th Apr 2024), rising from $0.00001 to $0.0600. During the last trading day the stock fluctuated 0% from a day low at $0.0600 to a day high of $0.0600. The price has been going up and down for this period, and there has been a 5999900% gain for the last 2 weeks. Volume fell on the last day by -1 thousand shares and in total, 250 shares were bought and sold for approximately $15.00 . You should take into consideration that falling volume on higher prices causes divergence and may be an early warning about possible changes over the next couple of days.
The stock has broken the very wide and strong rising the short-term trend up and an even stronger rate of rising is indicated. For any reaction back there will now be support on the roof on the current trend broken at $0.0072, a level that may pose a second chance to hit a runner.
Ready to grow your portfolio? Here's your beginner's guide to opening a free brokerage account.
ONPH Signals & Forecast
The Oncology Pharma stock holds buy signals from both short and long-term Moving Averages giving a positive forecast for the stock. Also, there is a general buy signal from the relation between the two signals where the short-term average is above the long-term average. On corrections down, there will be some support from the lines at $0.0089 and $0.0019. A breakdown below any of these levels will issue sell signals. A buy signal was issued from a pivot bottom point on Wednesday, April 24, 2024, and so far it has risen 5,999,900.00%. Further rise is indicated until a new top pivot has been found. Furthermore, there is a buy signal from the 3 month Moving Average Convergence Divergence (MACD). Some negative signals were issued as well, and these may have some influence on the near short-term development. Volume fell during the last trading day while the price increased. This causes a divergence and may be considered as an early warning, but it may not be. The very low volume increases the risk and reduces the other technical signals issued.
 A buy signal from a double bottom formation was found on Wednesday, April 24, 2024 with a target of $0.0005. Despite whether the objective of the signal formation has been reached the stock may continue to perform well.
Support, Risk & Stop-loss for Oncology Pharma stock
There is no support from accumulated volume below today's level and given the right condition the stock may perform very badly in the next couple of days.
This stock may move very much during the day (volatility) and with periodic low trading volume this stock is considered to be "very high risk". During the last day, the stock moved $0 between high and low, or 0%. For the last week the stock has had daily average volatility of 41,960.00%.
The Oncology Pharma stock is extremely overbought on RSI14 (97). Normally this may pose a good selling opportunity but since the stock has broken the trend up, the chance for a major correction due to high RSI is very small as the stock will find support at the trend broken.
Our recommended stop-loss: $0.0585 (-2.56%) (This stock has very high daily movements and this gives very high risk. The RSI14 is 97 and this increases the risk substantially. There is a buy signal from a pivot bottom found 2 days ago.)
Trading Expectations (ONPH) For The Upcoming Trading Day Of Monday 29th
For the upcoming trading day on Monday, 29th we expect Oncology Pharma Inc. to open at $0.0600, and during the day (based on 14 day Average True Range), to move between $0.0507 and $0.0693, which gives a possible trading interval of +/-$0.0093 (+/-15.45%) up or down from last closing price. If Oncology Pharma Inc. takes out the full calculated possible swing range there will be an estimated 30.89% move between the lowest and the highest trading price during the day.
Is Oncology Pharma Inc. stock A Buy?
Several short-term signals are positive and the stock has broke the rising trend up, which indicates an even stronger rate of rising. We conclude that the current level may hold a buying opportunity as there is a fair chance for Oncology Pharma stock to perform well in the short-term period. We have upgraded our analysis conclusion for this stock since the last evaluation from a Sell to a Strong Buy candidate.
Current score: 7.805 Strong Buy Candidate Upgraded
Predicted Opening Price for Oncology Pharma Inc. of Monday, April 29, 2024
| Fair opening price April 29, 2024 | Current price |
|---|---|
| $0.0600 ( 0%) | $0.0600 |
The predicted opening price is based on yesterday's movements between high, low, and closing price.
Trading levels for ONPH
Fibonacci Support & Resistance Levels
| Level | Price | |||
|---|---|---|---|---|
| Resistance | R3 | 0.0600 | . | |
| R2 | 0.0600 | . | ||
| R1 | 0.0600 | . | ||
| Current price: | 0.0600 | |||
| Support | S1 | 0.0600 | . | |
| S2 | 0.0600 | . | ||
| S3 | 0.0600 | . |
Accumulated Volume Support & Resistance Levels
| Level | Price | |||
|---|---|---|---|---|
| Resistance | R3 | 0 | . | |
| R2 | 0 | . | ||
| R1 | 0 | . | ||
| Current price | 0.0600 | |||
| Support | S1 | 0 | . | |
| S2 | 0 | . | ||
| S3 | 0 | . |
FAQ
Click here for our free guide on how to buy Oncology Pharma Stock.